Turning Complex Derivative Data into Clear Market Insights

NSE & BSE Indices Futures and Options Open Interest Volume Analysis for 29/01/2026

Table of Contents
Today’s Futures and Options Open Interest Volume Analysis clearly shows that the market is not just rising on price — it is rising with participation, and that is the most important takeaway from the Open Interest Volume Analysis.
NIFTY and BANKNIFTY futures both added fresh long positions with strong volume expansion, confirming that institutions are building positions rather than trading intraday noise.
In NIFTY, the 7.49% jump in combined OI with 26.51% volume expansion is a textbook “fresh long build-up”, supported by increasing futures premium — a sign that traders are willing to pay up for forward exposure.
Weekly PCR jumped sharply from 0.826 to 0.972, showing aggressive put writing, while monthly PCR above 1.12 confirms that downside is being actively protected.
BANKNIFTY shows a mixed but healthy structure — February has fresh longs, while March has short covering, meaning banks are likely to support the index but with limited upside acceleration in the near term.
MIDCPNIFTY continues to be a relief rally driven by short covering, not fresh buying — an important distinction revealed only through Open Interest Volume Analysis.
SENSEX futures show strong institutional conviction, with OI and volume both rising above 50%, which usually happens when positional money enters.
Overall, the derivative structure suggests that smart money is positioning for stability with a positive bias, not an aggressive trending market — a classic “buy on dips” setup rather than a runaway rally.
NSE & BSE F&O Market Signals
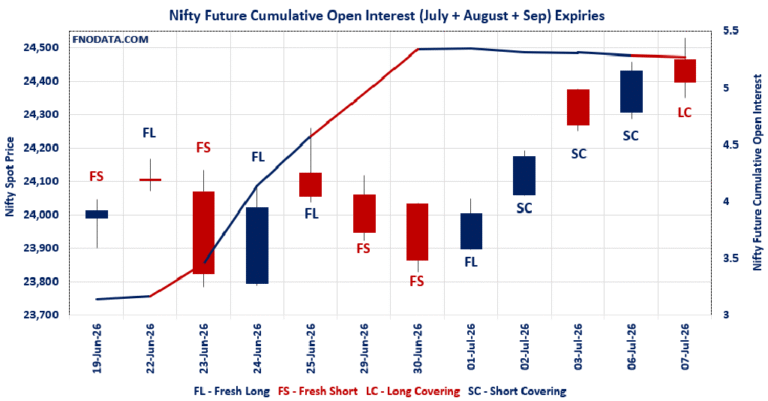
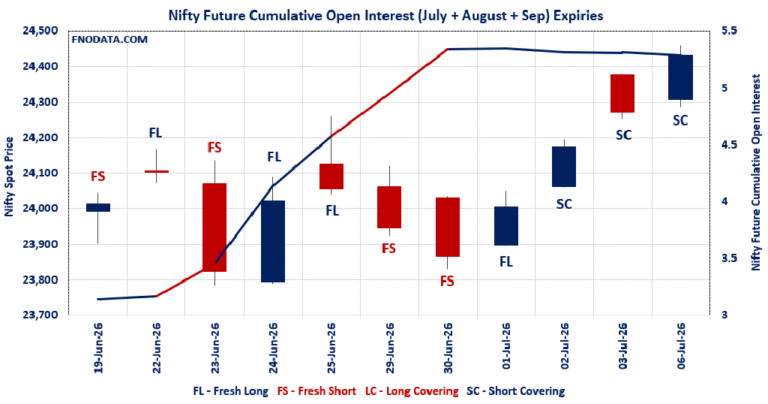
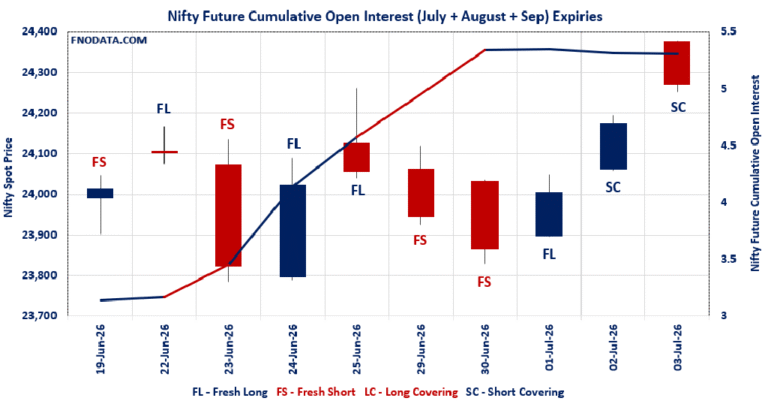
NIFTY Future analysis
NIFTY Spot closed at: 25418.9 (0.300%)
Combined = February + March + April
Combined Fut Open Interest Change: 7.49%
Combined Fut Volume Change: 26.51%
Combined Fut Open Interest Analysis: Fresh Long
Rollover: 7% Previous 7%
NIFTY FEBRUARY Future closed at: 25536.3 (0.338%)
February Fut Premium 117.4 (Increased by 9.75 points)
February Fut Open Interest Change: 7.47%
February Fut Volume Change: 27.27%
February Fut Open Interest Analysis: Fresh Long
NIFTY March Future closed at: 25707.1 (0.300%)
March Fut Premium 288.2 (Increased by 0.65 points)
March Fut Open Interest Change: 3.13%
March Fut Volume Change: 16.33%
March Fut Open Interest Analysis: Fresh Long
NIFTY Weekly Expiry (3/02/2026) Option Analysis
Put-Call Ratio (Open Interest): 0.972 (Increased from 0.826)
Put-Call Ratio (Volume): 0.881
Max Pain Level: 25350
Maximum CALL Open Interest: 26000
Maximum PUT Open Interest: 23300
Highest CALL Addition: 26500
Highest PUT Addition: 23300
NIFTY Monthly Expiry (24/02/2026) Option Analysis
Put-Call Ratio (Open Interest): 1.129 (Increased from 1.096)
Put-Call Ratio (Volume): 0.942
Max Pain Level: 25500
Maximum CALL Open Interest: 26000
Maximum PUT Open Interest: 25000
Highest CALL Addition: 27000
Highest PUT Addition: 25100
BANKNIFTY Future Analysis
BANKNIFTY Spot closed at: 59957.85 (0.602%)
Combined = February + March + April
Combined Fut Open Interest Change: 4.50%
Combined Fut Volume Change: -7.97%
Combined Fut Open Interest Analysis: Fresh Long
Rollover: 8% Previous 8%
BANKNIFTY FEBRUARY Future closed at: 60209.4 (0.573%)
February Fut Premium 251.55 (Decreased by -16.05 points)
February Fut Open Interest Change: 4.7%
February Fut Volume Change: -8.3%
February Fut Open Interest Analysis: Fresh Long
BANKNIFTY MARCH Future closed at: 60571.2 (0.543%)
March Fut Premium 613.35 (Decreased by -31.65 points)
March Fut Open Interest Change: -3.94%
March Fut Volume Change: -10.96%
March Fut Open Interest Analysis: Short Covering
BANKNIFTY Monthly Expiry (24/02/2026) Option Analysis
Put-Call Ratio (Open Interest): 1.197 (Increased from 1.098)
Put-Call Ratio (Volume): 0.873
Max Pain Level: 60000
Maximum CALL Open Interest: 60000
Maximum PUT Open Interest: 60000
Highest CALL Addition: 62000
Highest PUT Addition: 59500
MIDCPNIFTY Future Analysis
MIDCPNIFTY Spot closed at: 13424.35 (0.317%)
Combined = February + March + April
Combined Fut Open Interest Change: -1.07%
Combined Fut Volume Change: -38.33%
Combined Fut Open Interest Analysis: Short Covering
Rollover: 3% Previous 3%
MIDCPNIFTY FEBRUARY Future closed at: 13456.55 (0.354%)
February Fut Premium 32.2 (Increased by 5.05 points)
February Fut Open Interest Change: -1.07%
February Fut Volume Change: -38.96%
February Fut Open Interest Analysis: Short Covering
MIDCPNIFTY MARCH Future closed at: 13520.15 (0.323%)
March Fut Premium 95.8 (Increased by 1.1 points)
March Fut Open Interest Change: -1.12%
March Fut Volume Change: -22.74%
March Fut Open Interest Analysis: Short Covering
MIDCPNIFTY Monthly Expiry (24/02/2026) Option Analysis
Put-Call Ratio (Open Interest): 1.165 (Increased from 1.137)
Put-Call Ratio (Volume): 0.923
Max Pain Level: 13300
Maximum CALL Open Interest: 14500
Maximum PUT Open Interest: 13000
Highest CALL Addition: 14500
Highest PUT Addition: 12300
SENSEX Monthly Expiry (26/02/2026) Future
SENSEX Spot closed at: 82,566.37 (0.269%)
SENSEX Monthly Future closed at: 83,250.75 (0.350%)
Premium: 684.38 (Increased by 68.41 points)
Open Interest Change: 57.53%
Volume Change: 66.88%
Open Interest Analysis: Fresh Long
SENSEX Weekly Expiry (5/02/2026) Option Analysis
Put-Call Ratio (OI): 1.126 (Decreased from 1.151)
Put-Call Ratio (Volume): 0.884
Max Pain Level: 82500
Maximum CALL OI: 82500
Maximum PUT OI: 82500
Highest CALL Addition: 82500
Highest PUT Addition: 82500
FII & DII Cash Market Activity
FIIs Net SELL: ₹ 393.97 Cr.
DIIs Net BUY: ₹ 2,638.76 Cr.
FII Derivatives Activity
| FII Trading Stats | 29.01.26 | 28.01.26 | 27.01.26 |
| FII Cash (Provisional Data) | -393.97 | 480.26 | -3,068.49 |
| Index Future Open Interest Long Ratio | 12.29% | 12.62% | 11.85% |
| Index Future Volume Long Ratio | 38.52% | 51.19% | 44.54% |
| Call Option Open Interest Long Ratio | 43.49% | 43.24% | 43.16% |
| Call Option Volume Long Ratio | 50.00% | 49.73% | 50.30% |
| Put Option Open Interest Long Ratio | 64.87% | 67.34% | 69.93% |
| Put Option Volume Long Ratio | 49.76% | 50.19% | 49.69% |
| Stock Future Open Interest Long Ratio | 61.30% | 61.87% | 62.02% |
| Stock Future Volume Long Ratio | 45.15% | 49.18% | 52.90% |
| Index Futures | Fresh Short | Fresh Long | Long Covering |
| Index Options | Fresh Short | Fresh Short | Long Covering |
| Nifty Futures | Fresh Short | Fresh Long | Long Covering |
| Nifty Options | Fresh Short | Fresh Short | Short Covering |
| BankNifty Futures | Short Covering | Short Covering | Short Covering |
| BankNifty Options | Fresh Short | Fresh Long | Long Covering |
| FinNifty Futures | Long Covering | Long Covering | Fresh Short |
| FinNifty Options | Fresh Long | Fresh Short | Short Covering |
| MidcpNifty Futures | Short Covering | Fresh Long | Short Covering |
| MidcpNifty Options | Fresh Long | Fresh Long | Long Covering |
| NiftyNxt50 Futures | Long Covering | Fresh Short | Long Covering |
| NiftyNxt50 Options | Fresh Long | Fresh Long | Short Covering |
| Stock Futures | Long Covering | Fresh Short | Short Covering |
| Stock Options | Fresh Short | Fresh Short | Long Covering |
Fresh Long: Net Buy with Increase in Open Interest
Fresh Short: Net Sell with Increase in Open Interest
Short Covering: Net Buy with Decrease in Open Interest
Long Covering: Net Sell with Decrease in Open Interest
NSE & BSE Option market Trends : Options Insights
SENSEX Weekly Expiry (29/01/2026)
The SENSEX index closed at 82566.37. The SENSEX weekly expiry for FEBRUARY 5, 2026 has revealed key trends in open interest. The current Put/Call Ratio is at 1.126 against previous 1.151. The 82500PE option holds the maximum open interest, followed by the 82500CE and 77000PE options. Market participants have shown increased interest with significant open interest additions in the 82500PE option, with open interest additions also seen in the 82500CE and 77000PE options. On the other hand, open interest reductions were prominent in the 79500PE, 84400CE, and 79900PE options. Trading volume was highest in the 82500CE option, followed by the 82000PE and 83000CE options, indicating active trading in these strikes.
| SENSEX | Weekly | Expiry: | 05-02-2026 |
| Index Spot | PCR OI | Prev PCR OI | PCR VOL |
| 82566.37 | 1.126 | 1.151 | 0.884 |
| Total Open Interest Change in all CALLs & PUTs: | |||
| Current | Prior | Net Ch | |
| CALL: | 33,04,540 | 14,05,620 | 18,98,920 |
| PUT: | 37,20,120 | 16,18,540 | 21,01,580 |
| Top CALL Open Interest: | |||
| Strike | OI | OI Change | Volume |
| 82500 | 3,47,360 | 2,61,600 | 17,75,780 |
| 86000 | 2,27,120 | 1,37,740 | 8,07,120 |
| Top CALL Open Interest addition: | |||
| Strike | OI | OI Change | Volume |
| 82500 | 3,47,360 | 2,61,600 | 17,75,780 |
| 86000 | 2,27,120 | 1,37,740 | 8,07,120 |
| Top CALL Open Interest reduction: | |||
| Strike | OI | OI Change | Volume |
| 84400 | 11,480 | -2,320 | 69,840 |
| 80800 | 560 | -1,180 | 1,880 |
| Top CALL Volume: | |||
| Strike | OI | OI Change | Volume |
| 82500 | 3,47,360 | 2,61,600 | 17,75,780 |
| 83000 | 2,12,420 | 1,11,460 | 14,76,660 |
| Top PUT Open Interest: | |||
| Strike | OI | OI Change | Volume |
| 82500 | 3,49,120 | 2,72,960 | 13,85,800 |
| 77000 | 2,98,680 | 1,72,260 | 5,54,160 |
| Top PUT Open Interest addition: | |||
| Strike | OI | OI Change | Volume |
| 82500 | 3,49,120 | 2,72,960 | 13,85,800 |
| 77000 | 2,98,680 | 1,72,260 | 5,54,160 |
| Top PUT Open Interest reduction: | |||
| Strike | OI | OI Change | Volume |
| 79500 | 99,420 | -83,040 | 5,77,260 |
| 79900 | 9,960 | -1,680 | 69,160 |
| Top PUT Volume: | |||
| Strike | OI | OI Change | Volume |
| 82000 | 2,23,320 | 1,26,320 | 17,34,500 |
| 82500 | 3,49,120 | 2,72,960 | 13,85,800 |
NIFTY Weekly Expiry (3/02/2026)
The NIFTY index closed at 25418.9. The NIFTY weekly expiry for FEBRUARY 3, 2026 has revealed key trends in open interest. The current Put/Call Ratio is at 0.972 against previous 0.826. The 26000CE option holds the maximum open interest, followed by the 23300PE and 27000CE options. Market participants have shown increased interest with significant open interest additions in the 23300PE option, with open interest additions also seen in the 26500CE and 24500PE options. On the other hand, open interest reductions were prominent in the 25300CE, 25350CE, and 25650CE options. Trading volume was highest in the 25300CE option, followed by the 25300PE and 25200PE options, indicating active trading in these strikes.
| NIFTY | Weekly | Expiry: | 03-02-2026 |
| Index Spot | PCR OI | Prev PCR OI | PCR VOL |
| 25,418.90 | 0.972 | 0.826 | 0.881 |
| Total Open Interest Change in all CALLs & PUTs: | |||
| Current | Prior | Net Ch | |
| CALL: | 10,97,50,160 | 9,74,85,765 | 1,22,64,395 |
| PUT: | 10,66,49,790 | 8,04,84,820 | 2,61,64,970 |
| Top CALL Open Interest: | |||
| Strike | OI | OI Change | Volume |
| 26,000 | 89,32,885 | 11,79,555 | 9,79,806 |
| 27,000 | 68,76,545 | 13,83,070 | 4,02,904 |
| Top CALL Open Interest addition: | |||
| Strike | OI | OI Change | Volume |
| 26,500 | 68,72,190 | 18,22,990 | 4,45,702 |
| 27,000 | 68,76,545 | 13,83,070 | 4,02,904 |
| Top CALL Open Interest reduction: | |||
| Strike | OI | OI Change | Volume |
| 25,300 | 31,68,555 | -9,88,975 | 23,55,954 |
| 25,350 | 13,61,360 | -7,35,475 | 11,29,311 |
| Top CALL Volume: | |||
| Strike | OI | OI Change | Volume |
| 25,300 | 31,68,555 | -9,88,975 | 23,55,954 |
| 25,400 | 32,78,860 | -3,01,860 | 17,40,269 |
| Top PUT Open Interest: | |||
| Strike | OI | OI Change | Volume |
| 23,300 | 75,82,900 | 20,80,390 | 3,27,251 |
| 25,000 | 66,81,545 | 12,42,020 | 13,33,697 |
| Top PUT Open Interest addition: | |||
| Strike | OI | OI Change | Volume |
| 23,300 | 75,82,900 | 20,80,390 | 3,27,251 |
| 24,500 | 54,29,385 | 15,08,975 | 5,43,307 |
| Top PUT Open Interest reduction: | |||
| Strike | OI | OI Change | Volume |
| 23,650 | 3,51,715 | -3,53,600 | 64,949 |
| 25,800 | 7,23,060 | -47,645 | 14,583 |
| Top PUT Volume: | |||
| Strike | OI | OI Change | Volume |
| 25,300 | 45,35,245 | 6,17,630 | 22,62,265 |
| 25,200 | 42,98,905 | 12,67,110 | 20,88,321 |
NIFTY Monthly Expiry (24/02/2026)
The NIFTY index closed at 25418.9. The NIFTY monthly expiry for FEBRUARY 24, 2026 has revealed key trends in open interest. The current Put/Call Ratio is at 1.129 against previous 1.096. The 25000PE option holds the maximum open interest, followed by the 26000CE and 25500CE options. Market participants have shown increased interest with significant open interest additions in the 25100PE option, with open interest additions also seen in the 27000CE and 25600PE options. On the other hand, open interest reductions were prominent in the 25300CE, 28000CE, and 25200CE options. Trading volume was highest in the 26000CE option, followed by the 25500CE and 25000PE options, indicating active trading in these strikes.
| NIFTY | Monthly | Expiry: | 24-02-2026 |
| Index Spot | PCR OI | Prev PCR OI | PCR VOL |
| 25,418.90 | 1.129 | 1.096 | 0.942 |
| Total Open Interest Change in all CALLs & PUTs: | |||
| Current | Prior | Net Ch | |
| CALL: | 3,59,95,700 | 3,54,06,605 | 5,89,095 |
| PUT: | 4,06,38,195 | 3,88,08,640 | 18,29,555 |
| Top CALL Open Interest: | |||
| Strike | OI | OI Change | Volume |
| 26,000 | 42,67,120 | 1,05,170 | 84,786 |
| 25,500 | 35,67,590 | 2,17,295 | 74,120 |
| Top CALL Open Interest addition: | |||
| Strike | OI | OI Change | Volume |
| 27,000 | 32,46,230 | 3,96,760 | 32,613 |
| 25,500 | 35,67,590 | 2,17,295 | 74,120 |
| Top CALL Open Interest reduction: | |||
| Strike | OI | OI Change | Volume |
| 25,300 | 14,43,585 | -1,21,485 | 58,935 |
| 28,000 | 7,81,560 | -1,07,055 | 10,719 |
| Top CALL Volume: | |||
| Strike | OI | OI Change | Volume |
| 26,000 | 42,67,120 | 1,05,170 | 84,786 |
| 25,500 | 35,67,590 | 2,17,295 | 74,120 |
| Top PUT Open Interest: | |||
| Strike | OI | OI Change | Volume |
| 25,000 | 44,79,930 | 2,51,940 | 68,089 |
| 25,500 | 32,74,765 | 86,775 | 56,567 |
| Top PUT Open Interest addition: | |||
| Strike | OI | OI Change | Volume |
| 25,100 | 14,22,720 | 3,98,450 | 33,274 |
| 25,600 | 9,44,645 | 3,79,795 | 13,573 |
| Top PUT Open Interest reduction: | |||
| Strike | OI | OI Change | Volume |
| 25,200 | 17,47,460 | -79,105 | 42,404 |
| 24,500 | 24,81,115 | -29,835 | 56,535 |
| Top PUT Volume: | |||
| Strike | OI | OI Change | Volume |
| 25,000 | 44,79,930 | 2,51,940 | 68,089 |
| 25,300 | 18,69,140 | 28,600 | 63,117 |
BANKNIFTY Monthly Expiry (24/02/2026)
The BANKNIFTY index closed at 59957.85. The BANKNIFTY monthly expiry for FEBRUARY 24, 2026 has revealed key trends in open interest. The current Put/Call Ratio is at 1.197 against previous 1.098. The 60000CE option holds the maximum open interest, followed by the 60000PE and 58000PE options. Market participants have shown increased interest with significant open interest additions in the 59500PE option, with open interest additions also seen in the 60000PE and 59000PE options. On the other hand, open interest reductions were prominent in the 59600CE, 60000CE, and 59500CE options. Trading volume was highest in the 60000CE option, followed by the 59500PE and 59500CE options, indicating active trading in these strikes.
| BANKNIFTY | Monthly | Expiry: | 24-02-2026 |
| Index Spot | PCR OI | Prev PCR OI | PCR VOL |
| 59,957.85 | 1.197 | 1.098 | 0.873 |
| Total Open Interest Change in all CALLs & PUTs: | |||
| Current | Prior | Net Ch | |
| CALL: | 78,38,850 | 73,55,130 | 4,83,720 |
| PUT: | 93,86,700 | 80,72,370 | 13,14,330 |
| Top CALL Open Interest: | |||
| Strike | OI | OI Change | Volume |
| 60,000 | 16,18,110 | -34,050 | 1,21,359 |
| 62,000 | 5,36,610 | 77,190 | 41,870 |
| Top CALL Open Interest addition: | |||
| Strike | OI | OI Change | Volume |
| 62,000 | 5,36,610 | 77,190 | 41,870 |
| 60,100 | 1,40,790 | 55,470 | 21,433 |
| Top CALL Open Interest reduction: | |||
| Strike | OI | OI Change | Volume |
| 59,600 | 73,650 | -51,390 | 40,137 |
| 60,000 | 16,18,110 | -34,050 | 1,21,359 |
| Top CALL Volume: | |||
| Strike | OI | OI Change | Volume |
| 60,000 | 16,18,110 | -34,050 | 1,21,359 |
| 59,500 | 3,05,430 | -19,200 | 64,082 |
| Top PUT Open Interest: | |||
| Strike | OI | OI Change | Volume |
| 60,000 | 16,05,660 | 1,66,050 | 62,282 |
| 58,000 | 7,38,810 | -720 | 40,466 |
| Top PUT Open Interest addition: | |||
| Strike | OI | OI Change | Volume |
| 59,500 | 5,87,820 | 1,96,950 | 88,343 |
| 60,000 | 16,05,660 | 1,66,050 | 62,282 |
| Top PUT Open Interest reduction: | |||
| Strike | OI | OI Change | Volume |
| 61,200 | 16,950 | -11,340 | 1,179 |
| 57,400 | 34,440 | -5,160 | 2,063 |
| Top PUT Volume: | |||
| Strike | OI | OI Change | Volume |
| 59,500 | 5,87,820 | 1,96,950 | 88,343 |
| 60,000 | 16,05,660 | 1,66,050 | 62,282 |
MIDCPNIFTY Monthly Expiry (24/02/2026)
The MIDCPNIFTY index closed at 13424.35. The MIDCPNIFTY monthly expiry for FEBRUARY 24, 2026, 2025 has revealed key trends in open interest. The current Put/Call Ratio is at 1.165 against previous 1.137. The 13000PE option holds the maximum open interest, followed by the 12500PE and 14500CE options. Market participants have shown increased interest with significant open interest additions in the 14500CE option, with open interest additions also seen in the 14300CE and 12300PE options. On the other hand, open interest reductions were prominent in the 67000PE, 67500CE, and 59500PE options. Trading volume was highest in the 13400CE option, followed by the 13500CE and 14000CE options, indicating active trading in these strikes.
| MIDCPNIFTY | Monthly | Expiry: | 24-02-2026 |
| Index Spot | PCR OI | Prev PCR OI | PCR VOL |
| 13,424.35 | 1.165 | 1.137 | 0.923 |
| Total Open Interest Change in all CALLs & PUTs: | |||
| Current | Prior | Net Ch | |
| CALL: | 44,57,280 | 35,51,760 | 9,05,520 |
| PUT: | 51,94,920 | 40,38,600 | 11,56,320 |
| Top CALL Open Interest: | |||
| Strike | OI | OI Change | Volume |
| 14,500 | 5,95,800 | 2,25,600 | 5,313 |
| 14,000 | 4,66,920 | 18,840 | 10,719 |
| Top CALL Open Interest addition: | |||
| Strike | OI | OI Change | Volume |
| 14,500 | 5,95,800 | 2,25,600 | 5,313 |
| 14,300 | 2,91,240 | 1,52,280 | 4,268 |
| Top CALL Open Interest reduction: | |||
| Strike | OI | OI Change | Volume |
| 13,200 | 1,17,000 | -11,400 | 1,702 |
| 13,250 | 30,120 | -8,880 | 648 |
| Top CALL Volume: | |||
| Strike | OI | OI Change | Volume |
| 13,400 | 2,19,120 | 39,600 | 11,576 |
| 13,500 | 3,86,040 | 43,560 | 11,015 |
| Top PUT Open Interest: | |||
| Strike | OI | OI Change | Volume |
| 13,000 | 8,11,680 | 1,03,920 | 7,869 |
| 12,500 | 7,26,120 | 1,03,080 | 9,118 |
| Top PUT Open Interest addition: | |||
| Strike | OI | OI Change | Volume |
| 12,300 | 1,93,080 | 1,52,160 | 6,160 |
| 13,000 | 8,11,680 | 1,03,920 | 7,869 |
| Top PUT Open Interest reduction: | |||
| Strike | OI | OI Change | Volume |
| 12,200 | 1,38,600 | -27,240 | 2,540 |
| 13,200 | 2,52,960 | -18,360 | 5,744 |
| Top PUT Volume: | |||
| Strike | OI | OI Change | Volume |
| 13,300 | 3,22,080 | 83,280 | 9,859 |
| 12,500 | 7,26,120 | 1,03,080 | 9,118 |
Conclusion: What the NSE & BSE Indices Futures and Options Open Interest Volume Analysis Tells Us
Open Interest Volume Analysis confirms that the trend remains positive but controlled, meaning traders should shift from breakout chasing to level-based strategies.
For NIFTY:
25350–25500 remains the most important battle zone (Max Pain + heavy OI).
As long as fresh longs remain intact and PCR stays near 1, dip-buying near 25350–25400 is statistically safer than shorting.
Heavy call additions at 26500–27000 indicate upside is capped unless fresh long OI expands further.
For BANKNIFTY:
The 60000 strike is a magnet (both max call and put OI).
Premium compression in futures signals range-bound strength, not weakness.
Traders should use 60000 as pivot and trade ranges until fresh OI expansion appears.
For MIDCPNIFTY:
The rally is fragile because it’s driven by short covering.
Any fresh OI addition on the downside can reverse momentum quickly — avoid aggressive longs here.
For SENSEX:
Strong OI + volume expansion confirms positional bullishness, making SENSEX the most structurally stable index right now.
Final takeaway:
The market is in “accumulation with protection” mode, and Open Interest Volume Analysis clearly shows that smart money is preparing for upside but without removing hedges.
Strategy = Buy on dips, sell calls at higher strikes, and avoid over-leveraging until fresh OI expansion confirms trend acceleration.
Check Previous Day’s NSE & BSE Indices F&O Analysis
FII / FPI trading activity in Capital Market Segment
NSE Derivatives Raw Data
BSE Derivatives Raw Data
Disclaimer
fnodata.com is a financial blog providing research-based data and analysis. The content creator of the fnodata.com is not a SEBI registered Investment Advisor. The content on this blog is for informational purposes only and should not be considered as investment advice. You are responsible for your own investment decisions. You should consult with a financial advisor or conduct your own research before making any investment decisions.