Turning Complex Derivative Data into Clear Market Insights

NSE & BSE Indices Futures and Options Open Interest Volume Analysis for 1/02/2026
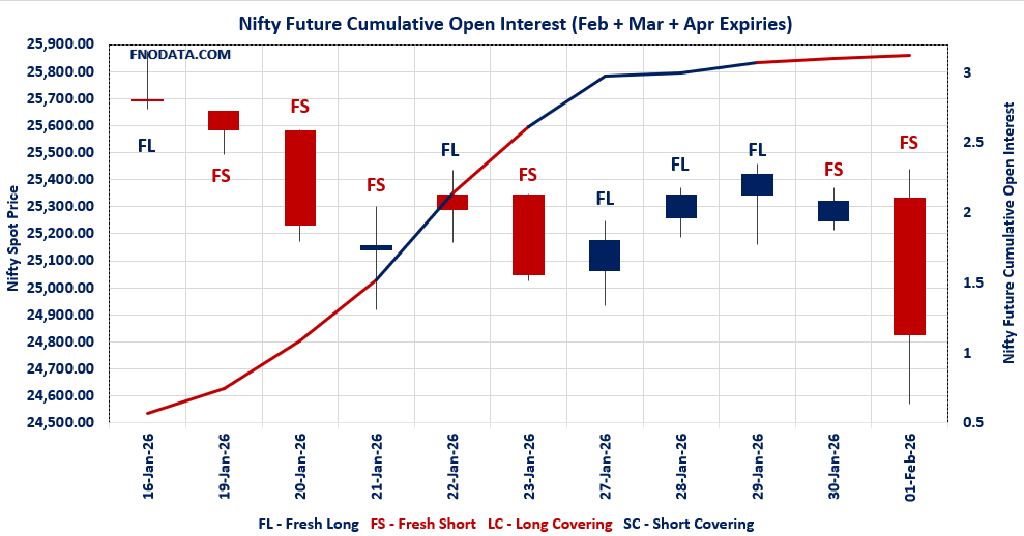
Table of Contents
Open Interest Volume Analysis clearly signals aggressive risk-off positioning as NIFTY, BANKNIFTY, MIDCPNIFTY, and SENSEX all witnessed simultaneous price decline + sharp OI expansion, a classic footprint of fresh short build-up by institutions.
The most important takeaway from today’s data is volume confirmation — futures volume jumped above 100% across most indices, which means today’s move is not panic selling by retailers, but decisive positioning by smart money.
NIFTY futures premium collapsed sharply, showing that bulls are unwilling to pay for carry, while weekly PCR dropped below 0.5, confirming short-term bearish sentiment dominance.
BANKNIFTY is the biggest red flag: OI + volume + rollover all rising together, which usually appears at the start of a directional downtrend, not at the end of one.
Options data strengthens this view — CALL writing is shifting higher, PUT writing is moving lower, indicating that market participants are rebuilding resistance zones and removing downside protection.
From an opening perspective, expect volatile and weak bias trade, where any gap-up is likely to be sold into unless futures OI starts unwinding.
In short: Today’s Open Interest Volume Analysis confirms that control has shifted to bears, and traders must focus more on risk management than bottom-fishing in the opening hour.
NSE & BSE F&O Market Signals
NIFTY Future analysis
NIFTY Spot closed at: 24825.45 (-1.956%)
Combined = February + March + April
Combined Fut Open Interest Change: 2.81%
Combined Fut Volume Change: 109.42%
Combined Fut Open Interest Analysis: Fresh Short
Rollover: 7% Previous 7%
NIFTY FEBRUARY Future closed at: 24853.5 (-2.215%)
February Fut Premium 28.05 (Decreased by -67.7 points)
February Fut Open Interest Change: 2.89%
February Fut Volume Change: 107.73%
February Fut Open Interest Analysis: Fresh Short
NIFTY March Future closed at: 25029.6 (-2.162%)
March Fut Premium 204.15 (Decreased by -58 points)
March Fut Open Interest Change: -1.32%
March Fut Volume Change: 130.30%
March Fut Open Interest Analysis: Long Covering
NIFTY Weekly Expiry (3/02/2026) Option Analysis
Put-Call Ratio (Open Interest): 0.428 (Decreased from 0.762)
Put-Call Ratio (Volume): 0.954
Max Pain Level: 25000
Maximum CALL Open Interest: 26000
Maximum PUT Open Interest: 23500
Highest CALL Addition: 26000
Highest PUT Addition: 23500
NIFTY Monthly Expiry (24/02/2026) Option Analysis
Put-Call Ratio (Open Interest): 1.048 (Decreased from 1.117)
Put-Call Ratio (Volume): 0.926
Max Pain Level: 25500
Maximum CALL Open Interest: 25500
Maximum PUT Open Interest: 25000
Highest CALL Addition: 25000
Highest PUT Addition: 24500
BANKNIFTY Future Analysis
BANKNIFTY Spot closed at: 58417.2 (-2.002%)
Combined = February + March + April
Combined Fut Open Interest Change: 8.46%
Combined Fut Volume Change: 137.09%
Combined Fut Open Interest Analysis: Fresh Short
Rollover: 9% Previous 8%
BANKNIFTY FEBRUARY Future closed at: 58701.4 (-2.015%)
February Fut Premium 284.2 (Decreased by -13.95 points)
February Fut Open Interest Change: 7.6%
February Fut Volume Change: 132.0%
February Fut Open Interest Analysis: Fresh Short
BANKNIFTY MARCH Future closed at: 59075.2 (-2.024%)
March Fut Premium 658 (Decreased by -27.35 points)
March Fut Open Interest Change: 12.66%
March Fut Volume Change: 202.40%
March Fut Open Interest Analysis: Fresh Short
BANKNIFTY Monthly Expiry (24/02/2026) Option Analysis
Put-Call Ratio (Open Interest): 0.855 (Decreased from 1.053)
Put-Call Ratio (Volume): 0.895
Max Pain Level: 59600
Maximum CALL Open Interest: 60000
Maximum PUT Open Interest: 60000
Highest CALL Addition: 59000
Highest PUT Addition: 56000
MIDCPNIFTY Future Analysis
MIDCPNIFTY Spot closed at: 13020.25 (-2.834%)
Combined = February + March + April
Combined Fut Open Interest Change: 6.91%
Combined Fut Volume Change: 64.63%
Combined Fut Open Interest Analysis: Fresh Short
Rollover: 3% Previous 3%
MIDCPNIFTY FEBRUARY Future closed at: 13025.5 (-2.802%)
February Fut Premium5.25 (Increased by 4.35 points)
February Fut Open Interest Change: 7.00%
February Fut Volume Change: 62.29%
February Fut Open Interest Analysis: Fresh Short
MIDCPNIFTY MARCH Future closed at: 13064.9 (-3.001%)
March Fut Premium44.65 (Decreased by -24.45 points)
March Fut Open Interest Change: 1.07%
March Fut Volume Change: 114.81%
March Fut Open Interest Analysis: Fresh Short
MIDCPNIFTY Monthly Expiry (24/02/2026) Option Analysis
Put-Call Ratio (Open Interest): 1.270 (Decreased from 1.339)
Put-Call Ratio (Volume): 0.793
Max Pain Level: 13300
Maximum CALL Open Interest: 14500
Maximum PUT Open Interest: 13000
Highest CALL Addition: 15000
Highest PUT Addition: 11600
SENSEX Monthly Expiry (26/02/2026) Future
SENSEX Spot closed at: 80,722.94 (-1.880%)
SENSEX Monthly Future closed at: 81,245.05 (-2.001%)
Premium: 522.11 (Decreased by -112.36 points)
Open Interest Change: 14.02%
Volume Change: 83.42%
Open Interest Analysis: Fresh Short
SENSEX Weekly Expiry (5/02/2026) Option Analysis
Put-Call Ratio (OI): 0.467 (Decreased from 0.840)
Put-Call Ratio (Volume): 0.963
Max Pain Level: 81600
Maximum CALL OI: 85000
Maximum PUT OI: 78000
Highest CALL Addition: 85000
Highest PUT Addition: 75000
FII & DII Cash Market Activity
FIIs Net SELL: ₹ 588.34 Cr.
DIIs Net SELL: ₹ 682.73 Cr.
FII Derivatives Activity
| FII Trading Stats | 1.02.26 | 30.01.26 | 29.01.26 |
| FII Cash (Provisional Data) | -588.34 | 2,251.37 | -393.97 |
| Index Future Open Interest Long Ratio | 11.71% | 12.10% | 12.29% |
| Index Future Volume Long Ratio | 41.38% | 41.58% | 38.52% |
| Call Option Open Interest Long Ratio | 42.96% | 45.42% | 43.49% |
| Call Option Volume Long Ratio | 49.53% | 50.16% | 50.00% |
| Put Option Open Interest Long Ratio | 65.74% | 65.35% | 64.87% |
| Put Option Volume Long Ratio | 50.25% | 50.39% | 49.76% |
| Stock Future Open Interest Long Ratio | 60.42% | 60.69% | 61.30% |
| Stock Future Volume Long Ratio | 45.87% | 45.67% | 45.15% |
| Index Futures | Fresh Short | Fresh Short | Fresh Short |
| Index Options | Fresh Short | Fresh Long | Fresh Short |
| Nifty Futures | Fresh Short | Fresh Short | Fresh Short |
| Nifty Options | Fresh Short | Fresh Long | Fresh Short |
| BankNifty Futures | Long Covering | Fresh Long | Short Covering |
| BankNifty Options | Fresh Short | Fresh Long | Fresh Short |
| FinNifty Futures | Fresh Long | Short Covering | Long Covering |
| FinNifty Options | Fresh Short | Fresh Short | Fresh Long |
| MidcpNifty Futures | Fresh Long | Short Covering | Short Covering |
| MidcpNifty Options | Short Covering | Fresh Long | Fresh Long |
| NiftyNxt50 Futures | Short Covering | Fresh Short | Long Covering |
| NiftyNxt50 Options | Fresh Short | Fresh Short | Fresh Long |
| Stock Futures | Long Covering | Long Covering | Long Covering |
| Stock Options | Fresh Long | Fresh Short | Fresh Short |
NSE & BSE Option market Trends : Options Insights
SENSEX Weekly Expiry (5/02/2026)
The SENSEX index closed at 80722.94. The SENSEX weekly expiry for FEBRUARY 5, 2026 has revealed key trends in open interest. The current Put/Call Ratio is at 0.467 against previous 0.840. The 85000CE option holds the maximum open interest, followed by the 86000CE and 83000CE options. Market participants have shown increased interest with significant open interest additions in the 85000CE option, with open interest additions also seen in the 83000CE and 84000CE options. On the other hand, open interest reductions were prominent in the 82000PE, 82100PE, and 82200PE options. Trading volume was highest in the 81000PE option, followed by the 82500CE and 80000PE options, indicating active trading in these strikes.
| SENSEX | Weekly | Expiry: | 05-02-2026 |
| Index Spot | PCR OI | Prev PCR OI | PCR VOL |
| 80722.94 | 0.467 | 0.840 | 0.963 |
| Total Open Interest Change in all CALLs & PUTs: | |||
| Current | Prior | Net Ch | |
| CALL: | 1,70,16,400 | 78,11,160 | 92,05,240 |
| PUT: | 79,44,880 | 65,61,920 | 13,82,960 |
| Top CALL Open Interest: | |||
| Strike | OI | OI Change | Volume |
| 85000 | 11,06,800 | 5,63,520 | 1,66,56,700 |
| 86000 | 8,74,180 | 3,34,540 | 96,65,220 |
| Top CALL Open Interest addition: | |||
| Strike | OI | OI Change | Volume |
| 85000 | 11,06,800 | 5,63,520 | 1,66,56,700 |
| 83000 | 7,98,220 | 5,09,180 | 1,75,70,580 |
| Top CALL Open Interest reduction: | |||
| Strike | OI | OI Change | Volume |
| 92900 | 2,980 | -9,100 | 66,900 |
| 82200 | 2,57,500 | -8,380 | 72,46,320 |
| Top CALL Volume: | |||
| Strike | OI | OI Change | Volume |
| 82500 | 7,58,060 | 3,31,240 | 1,80,39,300 |
| 83000 | 7,98,220 | 5,09,180 | 1,75,70,580 |
| Top PUT Open Interest: | |||
| Strike | OI | OI Change | Volume |
| 78000 | 5,82,640 | 47,780 | 92,00,760 |
| 77000 | 4,60,840 | 98,340 | 84,42,560 |
| Top PUT Open Interest addition: | |||
| Strike | OI | OI Change | Volume |
| 75000 | 3,60,660 | 1,94,900 | 58,01,420 |
| 80000 | 3,56,100 | 1,20,080 | 1,78,95,040 |
| Top PUT Open Interest reduction: | |||
| Strike | OI | OI Change | Volume |
| 82000 | 2,16,180 | -1,80,280 | 1,24,28,260 |
| 82100 | 73,420 | -1,37,940 | 51,99,280 |
| Top PUT Volume: | |||
| Strike | OI | OI Change | Volume |
| 81000 | 2,19,000 | 52,280 | 2,03,22,460 |
| 80000 | 3,56,100 | 1,20,080 | 1,78,95,040 |
NIFTY Weekly Expiry (3/02/2026)
The NIFTY index closed at 24825.45. The NIFTY weekly expiry for FEBRUARY 3, 2026 has revealed key trends in open interest. The current Put/Call Ratio is at 0.428 against previous 0.762. The 26000CE option holds the maximum open interest, followed by the 26500CE and 25500CE options. Market participants have shown increased interest with significant open interest additions in the 26000CE option, with open interest additions also seen in the 25500CE and 26500CE options. On the other hand, open interest reductions were prominent in the 25300PE, 24900PE, and 25200PE options. Trading volume was highest in the 25000PE option, followed by the 25500CE and 24500PE options, indicating active trading in these strikes.
| NIFTY | Weekly | Expiry: | 03-02-2026 |
| Index Spot | PCR OI | Prev PCR OI | PCR VOL |
| 24,825.45 | 0.428 | 0.762 | 0.954 |
| Total Open Interest Change in all CALLs & PUTs: | |||
| Current | Prior | Net Ch | |
| CALL: | 28,30,81,630 | 14,47,58,380 | 13,83,23,250 |
| PUT: | 12,11,57,335 | 11,02,85,565 | 1,08,71,770 |
| Top CALL Open Interest: | |||
| Strike | OI | OI Change | Volume |
| 26,000 | 2,13,87,600 | 98,69,405 | 56,81,274 |
| 26,500 | 1,91,54,590 | 87,62,065 | 24,73,223 |
| Top CALL Open Interest addition: | |||
| Strike | OI | OI Change | Volume |
| 26,000 | 2,13,87,600 | 98,69,405 | 56,81,274 |
| 25,500 | 1,61,66,670 | 94,96,695 | 62,97,402 |
| Top CALL Open Interest reduction: | |||
| Strike | OI | OI Change | Volume |
| 26,550 | 8,56,895 | -3,61,075 | 4,26,276 |
| 27,300 | 7,69,405 | -1,06,665 | 2,02,149 |
| Top CALL Volume: | |||
| Strike | OI | OI Change | Volume |
| 25,500 | 1,61,66,670 | 94,96,695 | 62,97,402 |
| 26,000 | 2,13,87,600 | 98,69,405 | 56,81,274 |
| Top PUT Open Interest: | |||
| Strike | OI | OI Change | Volume |
| 23,500 | 1,25,83,675 | 57,60,625 | 16,38,948 |
| 23,300 | 1,17,48,360 | 34,61,705 | 15,26,410 |
| Top PUT Open Interest addition: | |||
| Strike | OI | OI Change | Volume |
| 23,500 | 1,25,83,675 | 57,60,625 | 16,38,948 |
| 23,300 | 1,17,48,360 | 34,61,705 | 15,26,410 |
| Top PUT Open Interest reduction: | |||
| Strike | OI | OI Change | Volume |
| 25,300 | 22,51,925 | -27,00,620 | 33,36,819 |
| 24,900 | 20,00,245 | -24,92,945 | 41,37,812 |
| Top PUT Volume: | |||
| Strike | OI | OI Change | Volume |
| 25,000 | 49,07,955 | -19,56,695 | 71,21,679 |
| 24,500 | 65,91,715 | 9,95,020 | 57,08,915 |
NIFTY Monthly Expiry (24/02/2026)
The NIFTY index closed at 24825.45. The NIFTY monthly expiry for FEBRUARY 24, 2026 has revealed key trends in open interest. The current Put/Call Ratio is at 1.048 against previous 1.117. The 25500CE option holds the maximum open interest, followed by the 25000PE and 26000CE options. Market participants have shown increased interest with significant open interest additions in the 25000CE option, with open interest additions also seen in the 25500CE and 24500PE options. On the other hand, open interest reductions were prominent in the 26600CE, 25000PE, and 25400PE options. Trading volume was highest in the 25000PE option, followed by the 26000CE and 24000PE options, indicating active trading in these strikes.
| NIFTY | Monthly | Expiry: | 24-02-2026 |
| Index Spot | PCR OI | Prev PCR OI | PCR VOL |
| 24,825.45 | 1.048 | 1.117 | 0.926 |
| Total Open Interest Change in all CALLs & PUTs: | |||
| Current | Prior | Net Ch | |
| CALL: | 4,37,43,440 | 3,91,25,385 | 46,18,055 |
| PUT: | 4,58,55,550 | 4,36,98,915 | 21,56,635 |
| Top CALL Open Interest: | |||
| Strike | OI | OI Change | Volume |
| 25,500 | 54,14,370 | 10,92,195 | 1,84,250 |
| 26,000 | 48,61,480 | 52,650 | 2,45,660 |
| Top CALL Open Interest addition: | |||
| Strike | OI | OI Change | Volume |
| 25,000 | 35,02,460 | 12,04,710 | 1,46,666 |
| 25,500 | 54,14,370 | 10,92,195 | 1,84,250 |
| Top CALL Open Interest reduction: | |||
| Strike | OI | OI Change | Volume |
| 26,600 | 8,36,485 | -4,76,060 | 55,567 |
| 27,000 | 30,85,355 | -1,24,930 | 77,252 |
| Top CALL Volume: | |||
| Strike | OI | OI Change | Volume |
| 26,000 | 48,61,480 | 52,650 | 2,45,660 |
| 25,500 | 54,14,370 | 10,92,195 | 1,84,250 |
| Top PUT Open Interest: | |||
| Strike | OI | OI Change | Volume |
| 25,000 | 50,01,230 | -4,36,800 | 2,72,544 |
| 24,500 | 34,06,195 | 8,21,080 | 1,95,954 |
| Top PUT Open Interest addition: | |||
| Strike | OI | OI Change | Volume |
| 24,500 | 34,06,195 | 8,21,080 | 1,95,954 |
| 23,500 | 26,74,750 | 6,67,030 | 83,789 |
| Top PUT Open Interest reduction: | |||
| Strike | OI | OI Change | Volume |
| 25,000 | 50,01,230 | -4,36,800 | 2,72,544 |
| 25,400 | 19,98,880 | -2,37,575 | 61,025 |
| Top PUT Volume: | |||
| Strike | OI | OI Change | Volume |
| 25,000 | 50,01,230 | -4,36,800 | 2,72,544 |
| 24,000 | 30,71,640 | 3,93,965 | 2,21,059 |
BANKNIFTY Monthly Expiry (24/02/2026)
The BANKNIFTY index closed at 58417.2. The BANKNIFTY monthly expiry for FEBRUARY 24, 2026 has revealed key trends in open interest. The current Put/Call Ratio is at 0.855 against previous 1.053. The 60000CE option holds the maximum open interest, followed by the 60000PE and 58000PE options. Market participants have shown increased interest with significant open interest additions in the 59000CE option, with open interest additions also seen in the 61000CE and 56000PE options. On the other hand, open interest reductions were prominent in the 59500PE, 60000PE, and 59600PE options. Trading volume was highest in the 60000CE option, followed by the 59000PE and 58000PE options, indicating active trading in these strikes.
| BANKNIFTY | Monthly | Expiry: | 24-02-2026 |
| Index Spot | PCR OI | Prev PCR OI | PCR VOL |
| 58,417.20 | 0.855 | 1.053 | 0.895 |
| Total Open Interest Change in all CALLs & PUTs: | |||
| Current | Prior | Net Ch | |
| CALL: | 1,08,13,320 | 85,34,340 | 22,78,980 |
| PUT: | 92,42,970 | 89,89,410 | 2,53,560 |
| Top CALL Open Interest: | |||
| Strike | OI | OI Change | Volume |
| 60,000 | 18,02,880 | 1,49,310 | 1,96,165 |
| 62,000 | 6,36,780 | 92,190 | 97,509 |
| Top CALL Open Interest addition: | |||
| Strike | OI | OI Change | Volume |
| 59,000 | 4,70,970 | 1,84,590 | 76,736 |
| 61,000 | 6,09,450 | 1,73,760 | 1,05,106 |
| Top CALL Open Interest reduction: | |||
| Strike | OI | OI Change | Volume |
| 60,100 | 1,10,340 | -41,610 | 38,746 |
| 62,500 | 2,23,950 | -23,580 | 44,149 |
| Top CALL Volume: | |||
| Strike | OI | OI Change | Volume |
| 60,000 | 18,02,880 | 1,49,310 | 1,96,165 |
| 61,000 | 6,09,450 | 1,73,760 | 1,05,106 |
| Top PUT Open Interest: | |||
| Strike | OI | OI Change | Volume |
| 60,000 | 14,70,120 | -1,05,720 | 65,869 |
| 58,000 | 6,59,850 | -29,550 | 1,14,676 |
| Top PUT Open Interest addition: | |||
| Strike | OI | OI Change | Volume |
| 56,000 | 3,90,840 | 1,56,540 | 68,819 |
| 55,500 | 1,52,460 | 73,710 | 24,446 |
| Top PUT Open Interest reduction: | |||
| Strike | OI | OI Change | Volume |
| 59,500 | 3,40,500 | -1,49,910 | 93,460 |
| 60,000 | 14,70,120 | -1,05,720 | 65,869 |
| Top PUT Volume: | |||
| Strike | OI | OI Change | Volume |
| 59,000 | 5,90,010 | -1,620 | 1,51,781 |
| 58,000 | 6,59,850 | -29,550 | 1,14,676 |
MIDCPNIFTY Monthly Expiry (24/02/2026)
The MIDCPNIFTY index closed at 13020.25. The MIDCPNIFTY monthly expiry for FEBRUARY 24, 2026, 2025 has revealed key trends in open interest. The current Put/Call Ratio is at 1.270 against previous 1.339. The 13000PE option holds the maximum open interest, followed by the 12500PE and 12000PE options. Market participants have shown increased interest with significant open interest additions in the 15000CE option, with open interest additions also seen in the 14000CE and 13400CE options. On the other hand, open interest reductions were prominent in the 65900PE, 65900PE, and 65900CE options. Trading volume was highest in the 14000CE option, followed by the 13000PE and 13500CE options, indicating active trading in these strikes.
| MIDCPNIFTY | Monthly | Expiry: | 24-02-2026 |
| Index Spot | PCR OI | Prev PCR OI | PCR VOL |
| 13,020.25 | 1.270 | 1.339 | 0.793 |
| Total Open Interest Change in all CALLs & PUTs: | |||
| Current | Prior | Net Ch | |
| CALL: | 55,35,840 | 51,27,360 | 4,08,480 |
| PUT: | 70,30,200 | 68,66,280 | 1,63,920 |
| Top CALL Open Interest: | |||
| Strike | OI | OI Change | Volume |
| 14,500 | 7,37,400 | -83,880 | 11,307 |
| 14,000 | 6,32,760 | 1,04,280 | 27,477 |
| Top CALL Open Interest addition: | |||
| Strike | OI | OI Change | Volume |
| 15,000 | 3,52,440 | 1,33,200 | 4,177 |
| 14,000 | 6,32,760 | 1,04,280 | 27,477 |
| Top CALL Open Interest reduction: | |||
| Strike | OI | OI Change | Volume |
| 14,300 | 1,85,400 | -1,62,600 | 5,901 |
| 14,500 | 7,37,400 | -83,880 | 11,307 |
| Top CALL Volume: | |||
| Strike | OI | OI Change | Volume |
| 14,000 | 6,32,760 | 1,04,280 | 27,477 |
| 13,500 | 4,82,880 | 29,880 | 20,083 |
| Top PUT Open Interest: | |||
| Strike | OI | OI Change | Volume |
| 13,000 | 13,26,960 | -9,000 | 20,830 |
| 12,500 | 8,88,960 | 21,120 | 15,030 |
| Top PUT Open Interest addition: | |||
| Strike | OI | OI Change | Volume |
| 11,600 | 2,45,640 | 73,440 | 5,457 |
| 13,100 | 2,36,880 | 50,880 | 9,233 |
| Top PUT Open Interest reduction: | |||
| Strike | OI | OI Change | Volume |
| 13,300 | 1,90,320 | -1,22,520 | 11,383 |
| 12,900 | 1,32,360 | -72,720 | 7,404 |
| Top PUT Volume: | |||
| Strike | OI | OI Change | Volume |
| 13,000 | 13,26,960 | -9,000 | 20,830 |
| 12,000 | 7,37,640 | 49,200 | 15,750 |
Conclusion: What the NSE & BSE Indices Futures and Options Open Interest Volume Analysis Tells Us
Open Interest Volume Analysis leaves no ambiguity — this is a fresh short market, not a correction, because price fall is backed by rising OI + explosive volume, especially in BANKNIFTY and SENSEX.
Weekly options show fear rising fast (PCR below 0.5 in NIFTY & SENSEX), while monthly options still show slow repositioning, meaning the market is preparing for more downside before stability.
Max Pain levels are far above current prices, which increases the probability of mean reversion rallies, but those rallies should be treated as sell-on-rise opportunities until OI unwinds.
MIDCPNIFTY’s aggressive short build-up suggests broader market weakness is not over, so stock-specific longs should be avoided unless they show relative strength + delivery support.
The key trigger to watch is OI reduction with price stability — only then can we say shorts are covering and the market is preparing for a base.
Actionable Trading Plan from Derivative Data:
✅ Intraday traders: Trade with trend, sell resistance, avoid long carry trades.
⚠️ Positional traders: Wait for OI unwinding before building longs.
🛑 Options traders: Prefer call spreads / bear spreads over naked selling.
👀 Investors: Stay patient — derivatives are still pricing in downside risk.
Final word: Until Open Interest Volume Analysis shows short covering instead of short building, the market remains in a sell-on-rise regime and discipline will outperform prediction.
Check Previous Day’s NSE & BSE Indices F&O Analysis
FII / FPI trading activity in Capital Market Segment
NSE Derivatives Raw Data
BSE Derivatives Raw Data
Disclaimer
fnodata.com is a financial blog providing research-based data and analysis. The content creator of the fnodata.com is not a SEBI registered Investment Advisor. The content on this blog is for informational purposes only and should not be considered as investment advice. You are responsible for your own investment decisions. You should consult with a financial advisor or conduct your own research before making any investment decisions.
[…] Check Previous Day’s NSE & BSE Indices F&O Analysis […]