Turning Complex Derivative Data into Clear Market Insights

NSE & BSE Indices Futures and Options Open Interest Volume Analysis for 3/02/2026
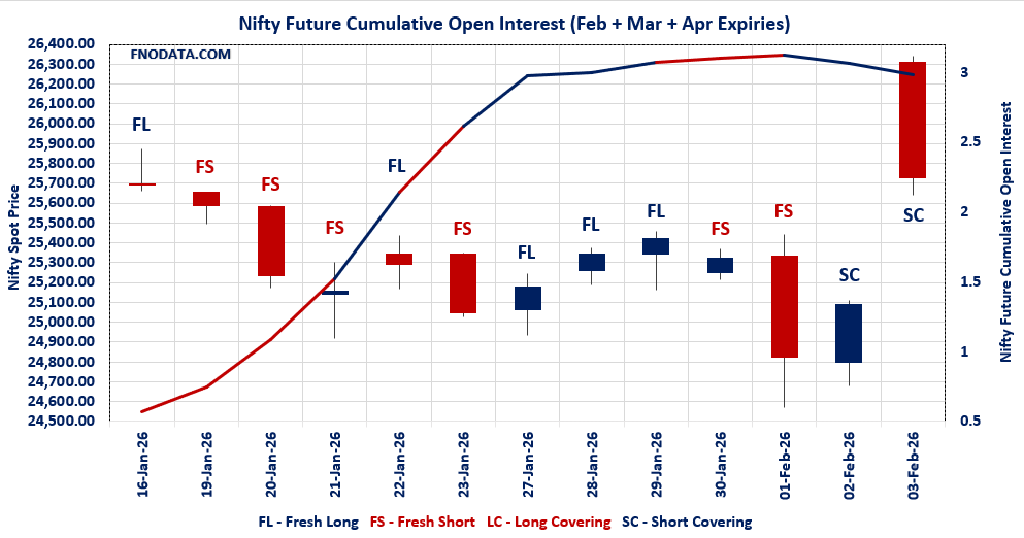
Table of Contents
If today’s rally felt powerful, the derivatives data confirms it wasn’t emotional buying — it was structurally driven.
Across NIFTY, BANKNIFTY, MIDCPNIFTY, and SENSEX, price expansion was backed by heavy volume participation and sharp Open Interest contraction, making Open Interest Volume Analysis the most critical tool to understand today’s move.
The market witnessed a textbook short-covering rally, where prices surged 2.4–3%, while futures Open Interest dropped sharply (7–23%) and volumes exploded (70–150%).
This combination clearly signals forced exit of bearish positions, not fresh aggressive longs — a crucial distinction for positional traders.
Rising futures premiums across NIFTY, MIDCPNIFTY, and SENSEX further validate urgency among shorts, while the slight premium compression in BANKNIFTY hints at relative caution from smart money at higher levels.
This divergence becomes evident only through Open Interest Volume Analysis, not price alone.
Options data adds another layer of insight:
Weekly PCR cooling in NIFTY despite a sharp rally suggests call writers still active at higher strikes.
Monthly PCR improvement points to medium-term bullish bias but with defined resistance zones.
In simple terms: today was not about euphoria — it was about position unwinding, risk reduction, and market re-balancing, setting the tone for how traders should approach the next few sessions.
NSE & BSE F&O Market Signals
NIFTY Future analysis
NIFTY Spot closed at: 25727.55 (2.548%)
Combined = February + March + April
Combined Fut Open Interest Change: -7.87%
Combined Fut Volume Change: 96.16%
Combined Fut Open Interest Analysis: Short Covering
Rollover: 8% Previous 8%
NIFTY FEBRUARY Future closed at: 25817.1 (2.686%)
February Fut Premium 89.55 (Increased by 36.15 points)
February Fut Open Interest Change: -8.31%
February Fut Volume Change: 96.57%
February Fut Open Interest Analysis: Short Covering
NIFTY March Future closed at: 25976.7 (2.685%)
March Fut Premium 249.15 (Increased by 40.15 points)
March Fut Open Interest Change: -9.10%
March Fut Volume Change: 101.78%
March Fut Open Interest Analysis: Short Covering
NIFTY Weekly Expiry (10/02/2026) Option Analysis
Put-Call Ratio (Open Interest): 0.845 (Decreased from 0.882)
Put-Call Ratio (Volume): 0.870
Max Pain Level: 25700
Maximum CALL Open Interest: 27000
Maximum PUT Open Interest: 24000
Highest CALL Addition: 27000
Highest PUT Addition: 24000
NIFTY Monthly Expiry (24/02/2026) Option Analysis
Put-Call Ratio (Open Interest): 1.145 (Increased from 1.067)
Put-Call Ratio (Volume): 0.916
Max Pain Level: 25700
Maximum CALL Open Interest: 26000
Maximum PUT Open Interest: 25500
Highest CALL Addition: 26000
Highest PUT Addition: 25500
BANKNIFTY Future Analysis
BANKNIFTY Spot closed at: 60041.3 (2.426%)
Combined = February + March + April
Combined Fut Open Interest Change: -14.73%
Combined Fut Volume Change: 68.50%
Combined Fut Open Interest Analysis: Short Covering
Rollover: 10% Previous 9%
BANKNIFTY FEBRUARY Future closed at: 60210 (2.323%)
February Fut Premium 168.7 (Decreased by -55.1 points)
February Fut Open Interest Change: -15.5%
February Fut Volume Change: 73.9%
February Fut Open Interest Analysis: Short Covering
BANKNIFTY MARCH Future closed at: 60538.8 (2.263%)
March Fut Premium 497.5 (Decreased by -82.7 points)
March Fut Open Interest Change: -13.77%
March Fut Volume Change: 14.33%
March Fut Open Interest Analysis: Short Covering
BANKNIFTY Monthly Expiry (24/02/2026) Option Analysis
Put-Call Ratio (Open Interest): 0.983 (Increased from 0.834)
Put-Call Ratio (Volume): 0.866
Max Pain Level: 60000
Maximum CALL Open Interest: 60000
Maximum PUT Open Interest: 60000
Highest CALL Addition: 60200
Highest PUT Addition: 60000
MIDCPNIFTY Future Analysis
MIDCPNIFTY Spot closed at: 13655.65 (3.007%)
Combined = February + March + April
Combined Fut Open Interest Change: -10.47%
Combined Fut Volume Change: 152.15%
Combined Fut Open Interest Analysis: Short Covering
Rollover: 3% Previous 3%
MIDCPNIFTY FEBRUARY Future closed at: 13698.1 (3.180%)
February Fut Premium 42.45 (Increased by 23.6 points)
February Fut Open Interest Change: -10.78%
February Fut Volume Change: 154.67%
February Fut Open Interest Analysis: Short Covering
MIDCPNIFTY MARCH Future closed at: 13758.5 (3.218%)
March Fut Premium 102.85 (Increased by 30.35 points)
March Fut Open Interest Change: -8.08%
March Fut Volume Change: 100.59%
March Fut Open Interest Analysis: Short Covering
MIDCPNIFTY Monthly Expiry (24/02/2026) Option Analysis
Put-Call Ratio (Open Interest): 0.974 (Decreased from 1.259)
Put-Call Ratio (Volume): 1.014
Max Pain Level: 13500
Maximum CALL Open Interest: 14500
Maximum PUT Open Interest: 13000
Highest CALL Addition: 14500
Highest PUT Addition: 13700
SENSEX Monthly Expiry (26/02/2026) Future
SENSEX Spot closed at: 83,739.13 (2.538%)
SENSEX Monthly Future closed at: 84,170.90 (2.559%)
Premium: 431.77 (Increased by 27.88 points)
Open Interest Change: -23.58%
Volume Change: 85.96%
Open Interest Analysis: Short Covering
SENSEX Weekly Expiry (5/02/2026) Option Analysis
Put-Call Ratio (OI): 0.982 (Increased from 0.935)
Put-Call Ratio (Volume): 0.845
Max Pain Level: 83600
Maximum CALL OI: 85000
Maximum PUT OI: 80000
Highest CALL Addition: 88000
Highest PUT Addition: 84000
FII & DII Cash Market Activity
FIIs Net BUY: ₹ 5,236.28 Cr.
DIIs Net BUY: ₹ 1,014.24 Cr.
FII Derivatives Activity
| FII Trading Stats | 3.02.26 | 2.02.26 | 1.02.26 |
| FII Cash (Provisional Data) | 5,236.28 | -1,832.46 | -588.34 |
| Index Future Open Interest Long Ratio | 16.85% | 11.67% | 11.71% |
| Index Future Volume Long Ratio | 65.67% | 53.71% | 41.38% |
| Call Option Open Interest Long Ratio | 45.41% | 44.11% | 42.96% |
| Call Option Volume Long Ratio | 49.95% | 50.19% | 49.53% |
| Put Option Open Interest Long Ratio | 62.79% | 63.07% | 65.74% |
| Put Option Volume Long Ratio | 49.82% | 49.89% | 50.25% |
| Stock Future Open Interest Long Ratio | 60.90% | 60.51% | 60.42% |
| Stock Future Volume Long Ratio | 52.41% | 50.80% | 45.87% |
| Index Futures | Short Covering | Short Covering | Fresh Short |
| Index Options | Long Covering | Fresh Long | Fresh Short |
| Nifty Futures | Short Covering | Short Covering | Fresh Short |
| Nifty Options | Long Covering | Short Covering | Fresh Short |
| BankNifty Futures | Fresh Long | Fresh Short | Long Covering |
| BankNifty Options | Fresh Short | Fresh Long | Fresh Short |
| FinNifty Futures | Short Covering | Fresh Short | Fresh Long |
| FinNifty Options | Fresh Short | Fresh Short | Fresh Short |
| MidcpNifty Futures | Short Covering | Fresh Long | Fresh Long |
| MidcpNifty Options | Fresh Short | Fresh Long | Short Covering |
| NiftyNxt50 Futures | Fresh Long | Long Covering | Short Covering |
| NiftyNxt50 Options | Fresh Long | Fresh Long | Fresh Short |
| Stock Futures | Fresh Long | Fresh Long | Long Covering |
| Stock Options | Fresh Short | Fresh Short | Fresh Long |
NSE & BSE Option market Trends : Options Insights
SENSEX Weekly Expiry (5/02/2026)
The SENSEX index closed at 83739.13. The SENSEX weekly expiry for FEBRUARY 5, 2026 has revealed key trends in open interest. The current Put/Call Ratio is at 0.982 against previous 0.935. The 85000CE option holds the maximum open interest, followed by the 88000CE and 86000CE options. Market participants have shown increased interest with significant open interest additions in the 88000CE option, with open interest additions also seen in the 84000PE and 83000PE options. On the other hand, open interest reductions were prominent in the 83000CE, 82000CE, and 83500CE options. Trading volume was highest in the 84000CE option, followed by the 84000PE and 85000CE options, indicating active trading in these strikes.
| SENSEX | Weekly | Expiry: | 05-02-2026 |
| Index Spot | PCR OI | Prev PCR OI | PCR VOL |
| 83739.13 | 0.982 | 0.935 | 0.845 |
| Total Open Interest Change in all CALLs & PUTs: | |||
| Current | Prior | Net Ch | |
| CALL: | 2,32,24,100 | 1,53,66,780 | 78,57,320 |
| PUT: | 2,27,99,020 | 1,43,62,720 | 84,36,300 |
| Top CALL Open Interest: | |||
| Strike | OI | OI Change | Volume |
| 85000 | 16,40,200 | 6,50,180 | 2,65,30,200 |
| 88000 | 14,61,220 | 12,14,680 | 94,93,700 |
| Top CALL Open Interest addition: | |||
| Strike | OI | OI Change | Volume |
| 88000 | 14,61,220 | 12,14,680 | 94,93,700 |
| 89000 | 8,58,940 | 7,26,940 | 68,02,780 |
| Top CALL Open Interest reduction: | |||
| Strike | OI | OI Change | Volume |
| 83000 | 2,54,400 | -5,06,160 | 30,35,600 |
| 82000 | 1,31,460 | -3,79,500 | 14,95,540 |
| Top CALL Volume: | |||
| Strike | OI | OI Change | Volume |
| 84000 | 13,32,140 | 5,32,120 | 3,87,21,380 |
| 85000 | 16,40,200 | 6,50,180 | 2,65,30,200 |
| Top PUT Open Interest: | |||
| Strike | OI | OI Change | Volume |
| 80000 | 13,58,120 | 6,88,720 | 1,06,79,720 |
| 81000 | 12,09,320 | 5,48,460 | 1,25,18,660 |
| Top PUT Open Interest addition: | |||
| Strike | OI | OI Change | Volume |
| 84000 | 9,70,720 | 8,92,100 | 2,66,06,680 |
| 83000 | 9,18,000 | 8,37,760 | 1,61,99,040 |
| Top PUT Open Interest reduction: | |||
| Strike | OI | OI Change | Volume |
| 75000 | 3,07,500 | -2,32,360 | 39,59,920 |
| 74000 | 1,00,920 | -1,57,500 | 22,18,800 |
| Top PUT Volume: | |||
| Strike | OI | OI Change | Volume |
| 84000 | 9,70,720 | 8,92,100 | 2,66,06,680 |
| 83000 | 9,18,000 | 8,37,760 | 1,61,99,040 |
NIFTY Weekly Expiry (10/02/2026)
The NIFTY index closed at 25727.55. The NIFTY weekly expiry for FEBRUARY 10, 2026 has revealed key trends in open interest. The current Put/Call Ratio is at 0.845 against previous 0.882. The 27000CE option holds the maximum open interest, followed by the 26000CE and 24000PE options. Market participants have shown increased interest with significant open interest additions in the 27000CE option, with open interest additions also seen in the 24000PE and 26000CE options. On the other hand, open interest reductions were prominent in the 25400CE, 25300CE, and 25000CE options. Trading volume was highest in the 26000CE option, followed by the 25800CE and 25800PE options, indicating active trading in these strikes.
| NIFTY | Weekly | Expiry: | 10-02-2026 |
| Index Spot | PCR OI | Prev PCR OI | PCR VOL |
| 25,727.55 | 0.845 | 0.882 | 0.870 |
| Total Open Interest Change in all CALLs & PUTs: | |||
| Current | Prior | Net Ch | |
| CALL: | 8,79,54,815 | 3,94,10,020 | 4,85,44,795 |
| PUT: | 7,43,29,125 | 3,47,61,740 | 3,95,67,385 |
| Top CALL Open Interest: | |||
| Strike | OI | OI Change | Volume |
| 27,000 | 89,92,620 | 65,74,750 | 4,40,064 |
| 26,000 | 77,92,525 | 41,15,410 | 9,93,502 |
| Top CALL Open Interest addition: | |||
| Strike | OI | OI Change | Volume |
| 27,000 | 89,92,620 | 65,74,750 | 4,40,064 |
| 26,000 | 77,92,525 | 41,15,410 | 9,93,502 |
| Top CALL Open Interest reduction: | |||
| Strike | OI | OI Change | Volume |
| 25,400 | 6,63,520 | -8,79,645 | 48,985 |
| 25,300 | 8,94,855 | -8,41,425 | 57,188 |
| Top CALL Volume: | |||
| Strike | OI | OI Change | Volume |
| 26,000 | 77,92,525 | 41,15,410 | 9,93,502 |
| 25,800 | 52,56,940 | 36,87,970 | 7,76,343 |
| Top PUT Open Interest: | |||
| Strike | OI | OI Change | Volume |
| 24,000 | 64,45,335 | 41,99,910 | 3,08,332 |
| 25,000 | 59,04,145 | 33,95,210 | 4,39,515 |
| Top PUT Open Interest addition: | |||
| Strike | OI | OI Change | Volume |
| 24,000 | 64,45,335 | 41,99,910 | 3,08,332 |
| 25,800 | 37,03,245 | 35,90,860 | 6,14,587 |
| Top PUT Open Interest reduction: | |||
| Strike | OI | OI Change | Volume |
| 23,300 | 9,83,905 | -3,68,875 | 91,443 |
| 24,400 | 6,90,950 | -3,50,090 | 86,451 |
| Top PUT Volume: | |||
| Strike | OI | OI Change | Volume |
| 25,800 | 37,03,245 | 35,90,860 | 6,14,587 |
| 25,500 | 39,61,620 | 33,03,560 | 5,19,642 |
NIFTY Monthly Expiry (24/02/2026)
The NIFTY index closed at 25727.55. The NIFTY monthly expiry for FEBRUARY 24, 2026 has revealed key trends in open interest. The current Put/Call Ratio is at 1.145 against previous 1.067. The 26000CE option holds the maximum open interest, followed by the 25500PE and 25000PE options. Market participants have shown increased interest with significant open interest additions in the 25500PE option, with open interest additions also seen in the 25800PE and 26000CE options. On the other hand, open interest reductions were prominent in the 25500CE, 25400CE, and 25000CE options. Trading volume was highest in the 26000CE option, followed by the 25500PE and 26500CE options, indicating active trading in these strikes.
| NIFTY | Monthly | Expiry: | 24-02-2026 |
| Index Spot | PCR OI | Prev PCR OI | PCR VOL |
| 25,727.55 | 1.145 | 1.067 | 0.916 |
| Total Open Interest Change in all CALLs & PUTs: | |||
| Current | Prior | Net Ch | |
| CALL: | 4,23,80,390 | 4,38,28,330 | -14,47,940 |
| PUT: | 4,85,23,670 | 4,67,48,845 | 17,74,825 |
| Top CALL Open Interest: | |||
| Strike | OI | OI Change | Volume |
| 26,000 | 61,27,550 | 13,84,955 | 3,72,847 |
| 26,500 | 36,76,205 | 7,87,540 | 2,26,531 |
| Top CALL Open Interest addition: | |||
| Strike | OI | OI Change | Volume |
| 26,000 | 61,27,550 | 13,84,955 | 3,72,847 |
| 26,500 | 36,76,205 | 7,87,540 | 2,26,531 |
| Top CALL Open Interest reduction: | |||
| Strike | OI | OI Change | Volume |
| 25,500 | 31,70,310 | -29,80,185 | 1,59,002 |
| 25,400 | 9,61,285 | -9,30,020 | 42,503 |
| Top CALL Volume: | |||
| Strike | OI | OI Change | Volume |
| 26,000 | 61,27,550 | 13,84,955 | 3,72,847 |
| 26,500 | 36,76,205 | 7,87,540 | 2,26,531 |
| Top PUT Open Interest: | |||
| Strike | OI | OI Change | Volume |
| 25,500 | 52,07,800 | 20,22,995 | 2,28,192 |
| 25,000 | 43,93,480 | -5,02,580 | 2,00,649 |
| Top PUT Open Interest addition: | |||
| Strike | OI | OI Change | Volume |
| 25,500 | 52,07,800 | 20,22,995 | 2,28,192 |
| 25,800 | 19,05,930 | 13,87,945 | 1,27,783 |
| Top PUT Open Interest reduction: | |||
| Strike | OI | OI Change | Volume |
| 24,500 | 31,00,955 | -7,53,935 | 1,24,755 |
| 23,500 | 19,78,145 | -5,40,540 | 38,514 |
| Top PUT Volume: | |||
| Strike | OI | OI Change | Volume |
| 25,500 | 52,07,800 | 20,22,995 | 2,28,192 |
| 25,000 | 43,93,480 | -5,02,580 | 2,00,649 |
BANKNIFTY Monthly Expiry (24/02/2026)
The BANKNIFTY index closed at 60041.3. The BANKNIFTY monthly expiry for FEBRUARY 24, 2026 has revealed key trends in open interest. The current Put/Call Ratio is at 0.983 against previous 0.834. The 60000PE option holds the maximum open interest, followed by the 60000CE and 58000PE options. Market participants have shown increased interest with significant open interest additions in the 60000PE option, with open interest additions also seen in the 60200CE and 60100PE options. On the other hand, open interest reductions were prominent in the 60000CE, 59000CE, and 58500CE options. Trading volume was highest in the 60000CE option, followed by the 60000PE and 61000CE options, indicating active trading in these strikes.
| BANKNIFTY | Monthly | Expiry: | 24-02-2026 |
| Index Spot | PCR OI | Prev PCR OI | PCR VOL |
| 60,041.30 | 0.983 | 0.834 | 0.866 |
| Total Open Interest Change in all CALLs & PUTs: | |||
| Current | Prior | Net Ch | |
| CALL: | 1,03,85,640 | 1,19,99,970 | -16,14,330 |
| PUT: | 1,02,14,130 | 1,00,11,330 | 2,02,800 |
| Top CALL Open Interest: | |||
| Strike | OI | OI Change | Volume |
| 60,000 | 15,84,000 | -3,03,450 | 1,99,222 |
| 61,000 | 5,74,140 | -1,34,700 | 1,18,255 |
| Top CALL Open Interest addition: | |||
| Strike | OI | OI Change | Volume |
| 60,200 | 2,27,670 | 1,17,720 | 73,247 |
| 60,300 | 1,84,830 | 1,00,980 | 41,889 |
| Top CALL Open Interest reduction: | |||
| Strike | OI | OI Change | Volume |
| 60,000 | 15,84,000 | -3,03,450 | 1,99,222 |
| 59,000 | 3,63,180 | -2,47,830 | 36,593 |
| Top CALL Volume: | |||
| Strike | OI | OI Change | Volume |
| 60,000 | 15,84,000 | -3,03,450 | 1,99,222 |
| 61,000 | 5,74,140 | -1,34,700 | 1,18,255 |
| Top PUT Open Interest: | |||
| Strike | OI | OI Change | Volume |
| 60,000 | 18,24,840 | 3,93,780 | 1,89,713 |
| 58,000 | 8,17,950 | -39,510 | 90,848 |
| Top PUT Open Interest addition: | |||
| Strike | OI | OI Change | Volume |
| 60,000 | 18,24,840 | 3,93,780 | 1,89,713 |
| 60,100 | 1,65,360 | 1,13,310 | 61,138 |
| Top PUT Open Interest reduction: | |||
| Strike | OI | OI Change | Volume |
| 56,500 | 2,47,110 | -98,160 | 28,572 |
| 57,000 | 4,87,830 | -86,010 | 58,419 |
| Top PUT Volume: | |||
| Strike | OI | OI Change | Volume |
| 60,000 | 18,24,840 | 3,93,780 | 1,89,713 |
| 59,000 | 6,03,000 | 65,340 | 1,01,643 |
MIDCPNIFTY Monthly Expiry (24/02/2026)
The MIDCPNIFTY index closed at 13655.65. The MIDCPNIFTY monthly expiry for FEBRUARY 24, 2026, 2025 has revealed key trends in open interest. The current Put/Call Ratio is at 0.974 against previous 1.259. The 13000PE option holds the maximum open interest, followed by the 14500CE and 14000CE options. Market participants have shown increased interest with significant open interest additions in the 14500CE option, with open interest additions also seen in the 13700PE and 13700CE options. On the other hand, open interest reductions were prominent in the 68000CE, 66500CE, and 67500PE options. Trading volume was highest in the 13000PE option, followed by the 14000CE and 14500CE options, indicating active trading in these strikes.
| MIDCPNIFTY | Monthly | Expiry: | 24-02-2026 |
| Index Spot | PCR OI | Prev PCR OI | PCR VOL |
| 13,655.65 | 0.974 | 1.259 | 1.014 |
| Total Open Interest Change in all CALLs & PUTs: | |||
| Current | Prior | Net Ch | |
| CALL: | 62,69,400 | 56,74,320 | 5,95,080 |
| PUT: | 61,07,760 | 71,46,600 | -10,38,840 |
| Top CALL Open Interest: | |||
| Strike | OI | OI Change | Volume |
| 14,500 | 9,96,600 | 2,92,800 | 26,663 |
| 14,000 | 8,05,200 | 1,18,680 | 27,600 |
| Top CALL Open Interest addition: | |||
| Strike | OI | OI Change | Volume |
| 14,500 | 9,96,600 | 2,92,800 | 26,663 |
| 13,700 | 3,50,400 | 1,81,200 | 17,027 |
| Top CALL Open Interest reduction: | |||
| Strike | OI | OI Change | Volume |
| 13,500 | 2,96,280 | -1,84,080 | 9,837 |
| 13,400 | 1,77,480 | -1,70,640 | 4,280 |
| Top CALL Volume: | |||
| Strike | OI | OI Change | Volume |
| 14,000 | 8,05,200 | 1,18,680 | 27,600 |
| 14,500 | 9,96,600 | 2,92,800 | 26,663 |
| Top PUT Open Interest: | |||
| Strike | OI | OI Change | Volume |
| 13,000 | 9,99,840 | -3,82,680 | 28,845 |
| 12,000 | 6,82,680 | 42,240 | 8,261 |
| Top PUT Open Interest addition: | |||
| Strike | OI | OI Change | Volume |
| 13,700 | 2,56,800 | 2,16,840 | 13,356 |
| 13,600 | 1,67,880 | 1,30,920 | 8,313 |
| Top PUT Open Interest reduction: | |||
| Strike | OI | OI Change | Volume |
| 12,300 | 1,29,840 | -5,01,360 | 12,885 |
| 13,000 | 9,99,840 | -3,82,680 | 28,845 |
| Top PUT Volume: | |||
| Strike | OI | OI Change | Volume |
| 13,000 | 9,99,840 | -3,82,680 | 28,845 |
| 12,500 | 4,69,680 | -3,62,880 | 15,828 |
Conclusion: What the NSE & BSE Indices Futures and Options Open Interest Volume Analysis Tells Us
The dominant takeaway from today’s Open Interest Volume Analysis is clear: this was a short-covering rally, not a fresh long buildup.
That means momentum is strong, but sustainability depends on follow-through buying, not just absence of sellers.
NIFTY and MIDCPNIFTY show the healthiest structure, with rising premiums, strong volume expansion, and orderly OI unwinding — indicating higher probability of consolidation-to-upside rather than immediate reversal.
BANKNIFTY, despite the sharp move, shows early signs of supply near higher levels, as reflected by:
Falling futures premium + Symmetrical CALL–PUT OI at 60000
This suggests range expansion may slow unless fresh longs enter.
Options positioning highlights clear reference zones for traders:
NIFTY: 25700 remains the battlefield (max pain & option balance)
BANKNIFTY: 60000 acts as a psychological magnet
MIDCPNIFTY: 13500 is now a strong positional base
Actionable strategy going forward:
Avoid aggressive fresh longs at open after a short-covering day
Prefer buy-on-dip only if price holds with stable or rising Open Interest
Watch for OI addition with price stability — that will confirm the next trending leg
Bottom line:
Today’s rally reset market positioning. Open Interest Volume Analysis clearly tells us the risk has shifted from bearish to neutral-bullish — but confirmation is still pending.
The next session will decide whether this move evolves into a trend or pauses into consolidation.
Check Previous Day’s NSE & BSE Indices F&O Analysis
FII / FPI trading activity in Capital Market Segment
NSE Derivatives Raw Data
BSE Derivatives Raw Data
Disclaimer
fnodata.com is a financial blog providing research-based data and analysis. The content creator of the fnodata.com is not a SEBI registered Investment Advisor. The content on this blog is for informational purposes only and should not be considered as investment advice. You are responsible for your own investment decisions. You should consult with a financial advisor or conduct your own research before making any investment decisions.
[…] Check Previous Day’s NSE & BSE Indices F&O Analysis […]