Turning Complex Derivative Data into Clear Market Insights

NSE & BSE Indices Futures and Options Open Interest Volume Analysis for 10/02/2026
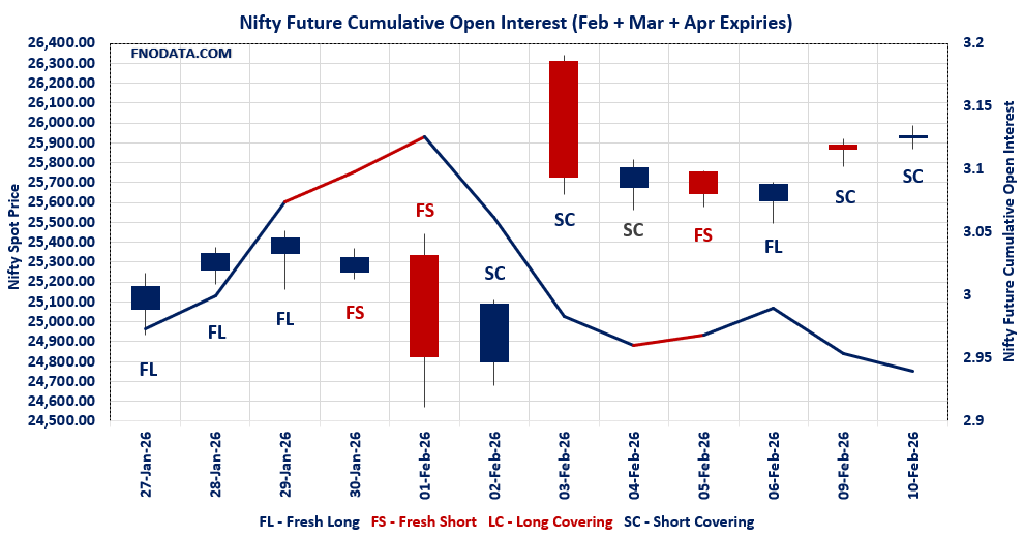
Table of Contents
If we read today’s derivatives data purely through the lens of Open Interest Volume Analysis, the market is clearly transitioning from panic-driven shorts to selective risk-taking, rather than entering a full-blown bullish expansion phase.
NIFTY’s marginal spot up-move accompanied by falling futures open interest and declining volumes confirms short covering, not aggressive long build-up. This is crucial — rallies driven by short covering tend to stall near resistance zones unless fresh longs step in.
The shift of participation from February to March contracts, with March futures showing fresh long addition, signals that positional traders are rolling forward with cautious optimism, while short-term traders are booking profits.
Options data further strengthens this narrative — PCR moving above 1 in both weekly and monthly expiries indicates put writers gaining confidence, yet far OTM call writing at higher strikes (26500–27500) warns of supply overhead.
In simple terms, Open Interest Volume Analysis suggests stability, not euphoria — a market preparing for consolidation with an upward bias rather than a runaway rally.
NSE & BSE F&O Market Signals
NIFTY Future analysis
NIFTY Spot closed at: 25935.15 (0.262%)
Combined = February + March + April
Combined Fut Open Interest Change: -1.37%
Combined Fut Volume Change: -5.58%
Combined Fut Open Interest Analysis: Short Covering
Rollover: 10% Previous 10%
NIFTY FEBRUARY Future closed at: 25985.6 (0.271%)
February Fut Premium 50.45 (Increased by 2.35 points)
February Fut Open Interest Change: -1.82%
February Fut Volume Change: -7.07%
February Fut Open Interest Analysis: Short Covering
NIFTY March Future closed at: 26138.7 (0.268%)
March Fut Premium 203.55 (Increased by 2.05 points)
March Fut Open Interest Change: 1.50%
March Fut Volume Change: 3.29%
March Fut Open Interest Analysis: Fresh Long
NIFTY Weekly Expiry (17/02/2026) Option Analysis
Put-Call Ratio (Open Interest): 1.026 (Increased from 0.988)
Put-Call Ratio (Volume): 0.956
Max Pain Level: 25900
Maximum CALL Open Interest: 27500
Maximum PUT Open Interest: 24000
Highest CALL Addition: 27500
Highest PUT Addition: 24000
NIFTY Monthly Expiry (24/02/2026) Option Analysis
Put-Call Ratio (Open Interest): 1.190 (Increased from 1.184)
Put-Call Ratio (Volume): 1.097
Max Pain Level: 25800
Maximum CALL Open Interest: 26500
Maximum PUT Open Interest: 25500
Highest CALL Addition: 26500
Highest PUT Addition: 25900
BANKNIFTY Future Analysis
BANKNIFTY Spot closed at: 60626.4 (-0.071%)
Combined = February + March + April
Combined Fut Open Interest Change: -1.16%
Combined Fut Volume Change: -40.02%
Combined Fut Open Interest Analysis: Long Covering
Rollover: 11% Previous 11%
BANKNIFTY FEBRUARY Future closed at: 60704 (-0.040%)
February Fut Premium 77.6 (Increased by 18.95 points)
February Fut Open Interest Change: -1.7%
February Fut Volume Change: -39.2%
February Fut Open Interest Analysis: Long Covering
BANKNIFTY MARCH Future closed at: 61044.2 (-0.039%)
March Fut Premium 417.8 (Increased by 18.95 points)
March Fut Open Interest Change: 2.76%
March Fut Volume Change: -47.55%
March Fut Open Interest Analysis: Fresh Short
BANKNIFTY Monthly Expiry (24/02/2026) Option Analysis
Put-Call Ratio (Open Interest): 1.005 (Decreased from 1.013)
Put-Call Ratio (Volume): 0.968
Max Pain Level: 60000
Maximum CALL Open Interest: 60000
Maximum PUT Open Interest: 60000
Highest CALL Addition: 60700
Highest PUT Addition: 60500
MIDCPNIFTY Future Analysis
MIDCPNIFTY Spot closed at: 13953.1 (0.609%)
Combined = February + March + April
Combined Fut Open Interest Change: -0.90%
Combined Fut Volume Change: -39.72%
Combined Fut Open Interest Analysis: Short Covering
Rollover: 4% Previous 4%
MIDCPNIFTY FEBRUARY Future closed at: 13944.6 (0.570%)
February Fut Discount -8.5 (Decreased by -5.35 points)
February Fut Open Interest Change: -1.05%
February Fut Volume Change: -41.45%
February Fut Open Interest Analysis: Short Covering
MIDCPNIFTY MARCH Future closed at: 14008.9 (0.549%)
March Fut Discount 55.8 (Decreased by -7.95 points)
March Fut Open Interest Change: 0.17%
March Fut Volume Change: -19.41%
March Fut Open Interest Analysis: Fresh Long
MIDCPNIFTY Monthly Expiry (24/02/2026) Option Analysis
Put-Call Ratio (Open Interest): 1.215 (Increased from 1.193)
Put-Call Ratio (Volume): 0.920
Max Pain Level: 13700
Maximum CALL Open Interest: 14500
Maximum PUT Open Interest: 13000
Highest CALL Addition: 14000
Highest PUT Addition: 14000
SENSEX Monthly Expiry (26/02/2026) Future
SENSEX Spot closed at: 84,273.92 (0.248%)
SENSEX Monthly Future closed at: 84,513.60 (0.264%)
Premium: 239.68 (Increased by 14.03 points)
Open Interest Change: -2.14%
Volume Change: -8.44%
Open Interest Analysis: Short Covering
SENSEX Weekly Expiry (12/02/2026) Option Analysis
Put-Call Ratio (OI): 1.163 (Increased from 1.052)
Put-Call Ratio (Volume): 0.944
Max Pain Level: 84200
Maximum CALL OI: 87000
Maximum PUT OI: 80000
Highest CALL Addition: 87000
Highest PUT Addition: 81000
FII & DII Cash Market Activity
FIIs Net BUY: ₹ 69.45 Cr.
DIIs Net BUY: ₹ 1,174.21 Cr.
FII Derivatives Activity
| FII Trading Stats | 10.02.26 | 9.02.26 | 6.02.26 |
| FII Cash (Provisional Data) | 69.45 | 2,254.64 | 1,950.77 |
| Index Future Open Interest Long Ratio | 21.69% | 18.96% | 18.32% |
| Index Future Volume Long Ratio | 67.82% | 58.51% | 39.79% |
| Call Option Open Interest Long Ratio | 51.10% | 50.71% | 48.94% |
| Call Option Volume Long Ratio | 49.93% | 50.31% | 50.20% |
| Put Option Open Interest Long Ratio | 61.47% | 58.31% | 59.57% |
| Put Option Volume Long Ratio | 49.72% | 49.87% | 50.11% |
| Stock Future Open Interest Long Ratio | 60.17% | 60.30% | 60.19% |
| Stock Future Volume Long Ratio | 48.43% | 50.84% | 47.47% |
| Index Futures | Fresh Long | Short Covering | Fresh Short |
| Index Options | Long Covering | Fresh Long | Fresh Long |
| Nifty Futures | Fresh Long | Short Covering | Fresh Short |
| Nifty Options | Long Covering | Fresh Long | Fresh Long |
| BankNifty Futures | Short Covering | Fresh Long | Long Covering |
| BankNifty Options | Fresh Short | Fresh Short | Fresh Long |
| FinNifty Futures | Fresh Long | Fresh Long | Short Covering |
| FinNifty Options | Fresh Short | Fresh Short | Short Covering |
| MidcpNifty Futures | Short Covering | Fresh Short | Fresh Short |
| MidcpNifty Options | Fresh Long | Fresh Short | Long Covering |
| NiftyNxt50 Futures | Short Covering | Fresh Long | Short Covering |
| NiftyNxt50 Options | Fresh Long | Fresh Long | Fresh Long |
| Stock Futures | Fresh Short | Fresh Long | Long Covering |
| Stock Options | Fresh Short | Fresh Short | Fresh Short |
Fresh Long: Net Buy with Increase in Open Interest
Fresh Short: Net Sell with Increase in Open Interest
Short Covering: Net Buy with Decrease in Open Interest
Long Covering: Net Sell with Decrease in Open Interest
NSE & BSE Option market Trends : Options Insights
SENSEX Weekly Expiry (12/02/2026)
The SENSEX index closed at 84273.92. The SENSEX weekly expiry for FEBRUARY 12, 2026 has revealed key trends in open interest. The current Put/Call Ratio is at 1.163 against previous 1.052. The 87000CE option holds the maximum open interest, followed by the 80000PE and 84000PE options. Market participants have shown increased interest with significant open interest additions in the 87000CE option, with open interest additions also seen in the 81000PE and 85000CE options. On the other hand, open interest reductions were prominent in the 84000CE, 88000CE, and 84100CE options. Trading volume was highest in the 84500CE option, followed by the 84400CE and 84300CE options, indicating active trading in these strikes.
| SENSEX | Weekly | Expiry: | 12-02-2026 |
| Index Spot | PCR OI | Prev PCR OI | PCR VOL |
| 84273.92 | 1.163 | 1.052 | 0.944 |
| Total Open Interest Change in all CALLs & PUTs: | |||
| Current | Prior | Net Ch | |
| CALL: | 2,03,13,360 | 1,23,49,280 | 79,64,080 |
| PUT: | 2,36,34,180 | 1,29,96,520 | 1,06,37,660 |
| Top CALL Open Interest: | |||
| Strike | OI | OI Change | Volume |
| 87000 | 19,54,280 | 13,30,940 | 69,06,220 |
| 85000 | 13,61,900 | 7,24,540 | 1,72,51,300 |
| Top CALL Open Interest addition: | |||
| Strike | OI | OI Change | Volume |
| 87000 | 19,54,280 | 13,30,940 | 69,06,220 |
| 85000 | 13,61,900 | 7,24,540 | 1,72,51,300 |
| Top CALL Open Interest reduction: | |||
| Strike | OI | OI Change | Volume |
| 84000 | 4,72,980 | -4,62,960 | 1,05,04,520 |
| 88000 | 7,13,380 | -1,88,420 | 45,61,480 |
| Top CALL Volume: | |||
| Strike | OI | OI Change | Volume |
| 84500 | 11,33,740 | 5,66,620 | 2,55,79,380 |
| 84400 | 7,13,060 | 4,91,840 | 2,48,70,200 |
| Top PUT Open Interest: | |||
| Strike | OI | OI Change | Volume |
| 80000 | 14,72,400 | 5,61,360 | 72,81,020 |
| 84000 | 14,40,040 | 4,71,720 | 2,13,03,260 |
| Top PUT Open Interest addition: | |||
| Strike | OI | OI Change | Volume |
| 81000 | 12,19,020 | 8,31,280 | 57,20,560 |
| 82000 | 10,17,920 | 5,77,460 | 58,68,280 |
| Top PUT Open Interest reduction: | |||
| Strike | OI | OI Change | Volume |
| 79600 | 18,540 | -18,160 | 2,15,120 |
| 73000 | 19,060 | -12,000 | 2,16,900 |
| Top PUT Volume: | |||
| Strike | OI | OI Change | Volume |
| 84300 | 5,92,320 | 5,36,380 | 2,14,28,840 |
| 84000 | 14,40,040 | 4,71,720 | 2,13,03,260 |
NIFTY Weekly Expiry (17/02/2026)
The NIFTY index closed at 25935.15. The NIFTY weekly expiry for FEBRUARY 17, 2026 has revealed key trends in open interest. The current Put/Call Ratio is at 1.026 against previous 0.988. The 27500CE option holds the maximum open interest, followed by the 27000CE and 26000CE options. Market participants have shown increased interest with significant open interest additions in the 27500CE option, with open interest additions also seen in the 27000CE and 24000PE options. On the other hand, open interest reductions were prominent in the 25850CE, 25800CE, and 25750CE options. Trading volume was highest in the 26000CE option, followed by the 25900PE and 26000PE options, indicating active trading in these strikes.
| NIFTY | Weekly | Expiry: | 17-02-2026 |
| Index Spot | PCR OI | Prev PCR OI | PCR VOL |
| 25,935.15 | 1.026 | 0.988 | 0.956 |
| Total Open Interest Change in all CALLs & PUTs: | |||
| Current | Prior | Net Ch | |
| CALL: | 6,42,58,090 | 2,90,44,405 | 3,52,13,685 |
| PUT: | 6,59,54,915 | 2,86,90,025 | 3,72,64,890 |
| Top CALL Open Interest: | |||
| Strike | OI | OI Change | Volume |
| 27,500 | 66,43,975 | 38,69,905 | 2,10,911 |
| 27,000 | 59,29,105 | 35,65,250 | 2,13,609 |
| Top CALL Open Interest addition: | |||
| Strike | OI | OI Change | Volume |
| 27,500 | 66,43,975 | 38,69,905 | 2,10,911 |
| 27,000 | 59,29,105 | 35,65,250 | 2,13,609 |
| Top CALL Open Interest reduction: | |||
| Strike | OI | OI Change | Volume |
| 25,850 | 6,88,480 | -62,205 | 78,779 |
| 25,800 | 15,17,945 | -35,425 | 1,44,690 |
| Top CALL Volume: | |||
| Strike | OI | OI Change | Volume |
| 26,000 | 58,81,330 | 28,85,415 | 7,06,627 |
| 25,900 | 25,13,225 | 10,73,800 | 4,21,308 |
| Top PUT Open Interest: | |||
| Strike | OI | OI Change | Volume |
| 24,000 | 51,86,805 | 32,65,860 | 1,55,121 |
| 25,000 | 44,93,320 | 24,42,895 | 1,80,651 |
| Top PUT Open Interest addition: | |||
| Strike | OI | OI Change | Volume |
| 24,000 | 51,86,805 | 32,65,860 | 1,55,121 |
| 25,000 | 44,93,320 | 24,42,895 | 1,80,651 |
| Top PUT Open Interest reduction: | |||
| Strike | OI | OI Change | Volume |
| 26,650 | 4,225 | -195 | 62 |
| 27,100 | 910 | -130 | 14 |
| Top PUT Volume: | |||
| Strike | OI | OI Change | Volume |
| 25,900 | 34,32,845 | 24,37,760 | 5,10,550 |
| 26,000 | 32,78,730 | 23,58,265 | 4,45,782 |
NIFTY Monthly Expiry (24/02/2026)
The NIFTY index closed at 25935.15. The NIFTY monthly expiry for FEBRUARY 24, 2026 has revealed key trends in open interest. The current Put/Call Ratio is at 1.190 against previous 1.184. The 25500PE option holds the maximum open interest, followed by the 26500CE and 26000CE options. Market participants have shown increased interest with significant open interest additions in the 26500CE option, with open interest additions also seen in the 25900PE and 26000PE options. On the other hand, open interest reductions were prominent in the 25500CE, 26000CE, and 25500PE options. Trading volume was highest in the 26000CE option, followed by the 26000PE and 25900PE options, indicating active trading in these strikes.
| NIFTY | Monthly | Expiry: | 24-02-2026 |
| Index Spot | PCR OI | Prev PCR OI | PCR VOL |
| 25,935.15 | 1.190 | 1.184 | 1.097 |
| Total Open Interest Change in all CALLs & PUTs: | |||
| Current | Prior | Net Ch | |
| CALL: | 4,54,85,765 | 4,42,08,320 | 12,77,445 |
| PUT: | 5,41,20,820 | 5,23,57,955 | 17,62,865 |
| Top CALL Open Interest: | |||
| Strike | OI | OI Change | Volume |
| 26,500 | 51,01,850 | 5,65,500 | 84,738 |
| 26,000 | 49,43,185 | -4,44,860 | 1,81,401 |
| Top CALL Open Interest addition: | |||
| Strike | OI | OI Change | Volume |
| 26,500 | 51,01,850 | 5,65,500 | 84,738 |
| 27,000 | 41,11,835 | 4,11,775 | 44,208 |
| Top CALL Open Interest reduction: | |||
| Strike | OI | OI Change | Volume |
| 25,500 | 21,15,295 | -4,80,740 | 24,629 |
| 26,000 | 49,43,185 | -4,44,860 | 1,81,401 |
| Top CALL Volume: | |||
| Strike | OI | OI Change | Volume |
| 26,000 | 49,43,185 | -4,44,860 | 1,81,401 |
| 26,500 | 51,01,850 | 5,65,500 | 84,738 |
| Top PUT Open Interest: | |||
| Strike | OI | OI Change | Volume |
| 25,500 | 53,71,535 | -4,13,595 | 88,728 |
| 25,000 | 47,17,765 | 1,65,685 | 60,674 |
| Top PUT Open Interest addition: | |||
| Strike | OI | OI Change | Volume |
| 25,900 | 15,07,805 | 5,17,725 | 91,342 |
| 26,000 | 36,28,105 | 4,53,375 | 1,31,723 |
| Top PUT Open Interest reduction: | |||
| Strike | OI | OI Change | Volume |
| 25,500 | 53,71,535 | -4,13,595 | 88,728 |
| 25,100 | 9,90,210 | -2,22,885 | 29,693 |
| Top PUT Volume: | |||
| Strike | OI | OI Change | Volume |
| 26,000 | 36,28,105 | 4,53,375 | 1,31,723 |
| 25,900 | 15,07,805 | 5,17,725 | 91,342 |
BANKNIFTY Monthly Expiry (24/02/2026)
The BANKNIFTY index closed at 60626.4. The BANKNIFTY monthly expiry for FEBRUARY 24, 2026 has revealed key trends in open interest. The current Put/Call Ratio is at 1.005 against previous 1.013. The 60000PE option holds the maximum open interest, followed by the 60000CE and 58000PE options. Market participants have shown increased interest with significant open interest additions in the 60700CE option, with open interest additions also seen in the 61000CE and 60500PE options. On the other hand, open interest reductions were prominent in the 55000PE, 58000PE, and 60000CE options. Trading volume was highest in the 60700CE option, followed by the 60700PE and 61000CE options, indicating active trading in these strikes.
| BANKNIFTY | Monthly | Expiry: | 24-02-2026 |
| Index Spot | PCR OI | Prev PCR OI | PCR VOL |
| 60,626.40 | 1.005 | 1.013 | 0.968 |
| Total Open Interest Change in all CALLs & PUTs: | |||
| Current | Prior | Net Ch | |
| CALL: | 1,33,92,480 | 1,26,96,390 | 6,96,090 |
| PUT: | 1,34,54,940 | 1,28,56,170 | 5,98,770 |
| Top CALL Open Interest: | |||
| Strike | OI | OI Change | Volume |
| 60,000 | 14,96,910 | -32,910 | 26,336 |
| 61,000 | 8,00,730 | 1,05,030 | 90,869 |
| Top CALL Open Interest addition: | |||
| Strike | OI | OI Change | Volume |
| 60,700 | 5,00,400 | 1,14,540 | 1,32,674 |
| 61,000 | 8,00,730 | 1,05,030 | 90,869 |
| Top CALL Open Interest reduction: | |||
| Strike | OI | OI Change | Volume |
| 60,000 | 14,96,910 | -32,910 | 26,336 |
| 61,700 | 1,16,130 | -22,860 | 10,384 |
| Top CALL Volume: | |||
| Strike | OI | OI Change | Volume |
| 60,700 | 5,00,400 | 1,14,540 | 1,32,674 |
| 61,000 | 8,00,730 | 1,05,030 | 90,869 |
| Top PUT Open Interest: | |||
| Strike | OI | OI Change | Volume |
| 60,000 | 20,20,680 | 35,970 | 71,221 |
| 58,000 | 8,55,780 | -37,560 | 20,905 |
| Top PUT Open Interest addition: | |||
| Strike | OI | OI Change | Volume |
| 60,500 | 6,33,990 | 1,03,110 | 82,942 |
| 60,700 | 4,05,900 | 80,040 | 1,21,367 |
| Top PUT Open Interest reduction: | |||
| Strike | OI | OI Change | Volume |
| 55,000 | 2,78,070 | -45,180 | 8,902 |
| 58,000 | 8,55,780 | -37,560 | 20,905 |
| Top PUT Volume: | |||
| Strike | OI | OI Change | Volume |
| 60,700 | 4,05,900 | 80,040 | 1,21,367 |
| 60,500 | 6,33,990 | 1,03,110 | 82,942 |
MIDCPNIFTY Monthly Expiry (24/02/2026)
The MIDCPNIFTY index closed at 13953.1. The MIDCPNIFTY monthly expiry for FEBRUARY 24, 2026, 2025 has revealed key trends in open interest. The current Put/Call Ratio is at 1.215 against previous 1.193. The 13000PE option holds the maximum open interest, followed by the 14500CE and 14000CE options. Market participants have shown increased interest with significant open interest additions in the 14000PE option, with open interest additions also seen in the 13900PE and 14000CE options. On the other hand, open interest reductions were prominent in the 69500PE, 66000PE, and 67000PE options. Trading volume was highest in the 14000CE option, followed by the 13900CE and 13900PE options, indicating active trading in these strikes.
| MIDCPNIFTY | Monthly | Expiry: | 24-02-2026 |
| Index Spot | PCR OI | Prev PCR OI | PCR VOL |
| 13,953.10 | 1.215 | 1.193 | 0.920 |
| Total Open Interest Change in all CALLs & PUTs: | |||
| Current | Prior | Net Ch | |
| CALL: | 65,40,720 | 64,15,200 | 1,25,520 |
| PUT: | 79,49,400 | 76,55,520 | 2,93,880 |
| Top CALL Open Interest: | |||
| Strike | OI | OI Change | Volume |
| 14,500 | 10,76,040 | -52,320 | 10,828 |
| 14,000 | 6,76,320 | 81,720 | 22,728 |
| Top CALL Open Interest addition: | |||
| Strike | OI | OI Change | Volume |
| 14,000 | 6,76,320 | 81,720 | 22,728 |
| 13,950 | 85,440 | 52,200 | 6,592 |
| Top CALL Open Interest reduction: | |||
| Strike | OI | OI Change | Volume |
| 13,850 | 90,000 | -70,920 | 2,059 |
| 14,500 | 10,76,040 | -52,320 | 10,828 |
| Top CALL Volume: | |||
| Strike | OI | OI Change | Volume |
| 14,000 | 6,76,320 | 81,720 | 22,728 |
| 13,900 | 1,91,760 | -3,120 | 13,363 |
| Top PUT Open Interest: | |||
| Strike | OI | OI Change | Volume |
| 13,000 | 10,97,040 | 62,040 | 6,815 |
| 12,500 | 4,82,160 | -54,360 | 2,459 |
| Top PUT Open Interest addition: | |||
| Strike | OI | OI Change | Volume |
| 14,000 | 3,31,200 | 1,42,080 | 8,249 |
| 13,900 | 2,56,560 | 1,30,440 | 11,986 |
| Top PUT Open Interest reduction: | |||
| Strike | OI | OI Change | Volume |
| 12,000 | 4,19,880 | -1,25,640 | 2,741 |
| 13,400 | 3,85,560 | -66,240 | 7,280 |
| Top PUT Volume: | |||
| Strike | OI | OI Change | Volume |
| 13,900 | 2,56,560 | 1,30,440 | 11,986 |
| 13,800 | 4,62,720 | 60,960 | 8,418 |
Conclusion: What the NSE & BSE Indices Futures and Options Open Interest Volume Analysis Tells Us
NIFTY & SENSEX:
Persistent short covering in futures, rising premiums, and improving PCRs indicate downside is getting protected near 25800–25900 (NIFTY) and 84200 (SENSEX).
However, heavy call OI at 26500–27500 means upside will be gradual, not vertical.
Action: Positional traders should stay long but trail stops aggressively; fresh longs are better only on OI-supported breakouts, not price-only moves.
BANKNIFTY:
The most cautious setup among all indices — long covering in near futures combined with fresh shorts in March clearly shows institutional hesitation.
Flat PCR near 1 and max pain at 60000 confirm a range-bound, mean-reverting structure.
Action: Prefer option selling strategies (iron condors / strangles) rather than directional bets until volume expansion returns.
MIDCPNIFTY:
Strongest internal structure today — short covering + improving PCR + fresh longs in March shows risk appetite returning selectively to midcaps.
Yet declining volumes warn that breakouts may lack follow-through.
Action: Bullish bias remains valid above 13700, but avoid leverage-heavy trades.
Big Picture Takeaway:
Today’s Open Interest Volume Analysis clearly favors “buy-on-dips” over “chase-the-rally” strategies.
The market is absorbing supply, not expanding aggressively, which makes patience and structure-based trading essential over the next few sessions.
👉 In summary:
This is a market where data-driven traders will outperform emotional traders. Watch OI + Volume together, not price alone — because right now, participation matters more than points.
Check Previous Day’s NSE & BSE Indices F&O Analysis
FII / FPI trading activity in Capital Market Segment
NSE Derivatives Raw Data
BSE Derivatives Raw Data
Disclaimer
fnodata.com is a financial blog providing research-based data and analysis. The content creator of the fnodata.com is not a SEBI registered Investment Advisor. The content on this blog is for informational purposes only and should not be considered as investment advice. You are responsible for your own investment decisions. You should consult with a financial advisor or conduct your own research before making any investment decisions.
[…] Check Previous Day’s NSE & BSE Indices F&O Analysis […]