Turning Complex Derivative Data into Clear Market Insights

NSE & BSE Indices Futures and Options Open Interest Volume Analysis for 11/02/2026
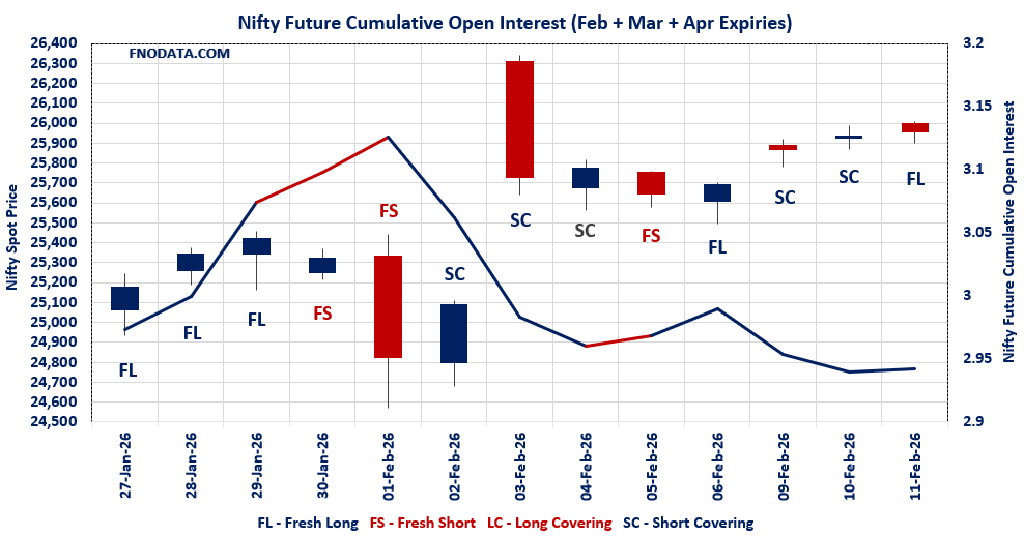
Table of Contents
Open Interest Volume Analysis for 11/02/2026 clearly shows that Indian indices are entering a selective accumulation phase, not a broad-based trending market.
NIFTY ended almost flat, but the rise in combined futures OI with declining volume is a classic signal of fresh longs entering cautiously, suggesting positional participants are building exposure but without urgency.
The sharp fall in NIFTY weekly PCR (OI) from 1.026 to 0.891 highlights aggressive CALL writing near 26000, confirming that upside is being capped in the near term despite long additions in futures.
BANKNIFTY tells a different story—short covering in February futures combined with fresh longs in March indicates a rollover-led bullish bias, especially as PCR (OI) rises above 1.12, hinting at improving sentiment in banking stocks.
MIDCPNIFTY remains the weakest link, where long covering at the index level and high volatility in March futures OI reflects rotational churn rather than directional confidence.
SENSEX derivatives show pure risk reduction, with sharp long unwinding and falling premium—signaling that smart money is trimming exposure rather than betting aggressively ahead of global and domestic cues.
Overall, today’s Open Interest Volume Analysis points to a range-bound market with stock-specific opportunities, where futures positioning and option writers are quietly dictating price behavior more than spot momentum.
NSE & BSE F&O Market Signals
NIFTY Future analysis
NIFTY Spot closed at: 25953.85 (0.072%)
Combined = February + March + April
Combined Fut Open Interest Change: 0.22%
Combined Fut Volume Change: -12.25%
Combined Fut Open Interest Analysis: Fresh Long
Rollover: 10% Previous 10%
NIFTY FEBRUARY Future closed at: 25994.2 (0.033%)
February Fut Premium 40.35 (Decreased by -10.1 points)
February Fut Open Interest Change: 0.04%
February Fut Volume Change: -10.19%
February Fut Open Interest Analysis: Fresh Long
NIFTY March Future closed at: 26151 (0.047%)
March Fut Premium 197.15 (Decreased by -6.4 points)
March Fut Open Interest Change: 1.46%
March Fut Volume Change: -21.13%
March Fut Open Interest Analysis: Fresh Long
NIFTY Weekly Expiry (17/02/2026) Option Analysis
Put-Call Ratio (Open Interest): 0.891 (Decreased from 1.026)
Put-Call Ratio (Volume): 1.070
Max Pain Level: 25950
Maximum CALL Open Interest: 26000
Maximum PUT Open Interest: 24500
Highest CALL Addition: 26000
Highest PUT Addition: 24500
NIFTY Monthly Expiry (24/02/2026) Option Analysis
Put-Call Ratio (Open Interest): 1.184 (Decreased from 1.190)
Put-Call Ratio (Volume): 1.099
Max Pain Level: 25800
Maximum CALL Open Interest: 26500
Maximum PUT Open Interest: 25500
Highest CALL Addition: 26500
Highest PUT Addition: 26000
BANKNIFTY Future Analysis
BANKNIFTY Spot closed at: 60745.35 (0.196%)
Combined = February + March + April
Combined Fut Open Interest Change: -0.19%
Combined Fut Volume Change: -3.19%
Combined Fut Open Interest Analysis: Short Covering
Rollover: 11% Previous 11%
BANKNIFTY FEBRUARY Future closed at: 60809 (0.173%)
February Fut Premium 63.65 (Decreased by -13.95 points)
February Fut Open Interest Change: -0.4%
February Fut Volume Change: -4.7%
February Fut Open Interest Analysis: Short Covering
BANKNIFTY MARCH Future closed at: 61152 (0.177%)
March Fut Premium 406.65 (Decreased by -11.15 points)
March Fut Open Interest Change: 1.18%
March Fut Volume Change: 14.67%
March Fut Open Interest Analysis: Fresh Long
BANKNIFTY Monthly Expiry (24/02/2026) Option Analysis
Put-Call Ratio (Open Interest): 1.127 (Increased from 1.005)
Put-Call Ratio (Volume): 1.094
Max Pain Level: 60200
Maximum CALL Open Interest: 60000
Maximum PUT Open Interest: 60000
Highest CALL Addition: 60800
Highest PUT Addition: 60000
MIDCPNIFTY Future Analysis
MIDCPNIFTY Spot closed at: 13952.8 (-0.002%)
Combined = February + March + April
Combined Fut Open Interest Change: -0.73%
Combined Fut Volume Change: 17.59%
Combined Fut Open Interest Analysis: Long Covering
Rollover: 5% Previous 4%
MIDCPNIFTY FEBRUARY Future closed at: 13950.2 (0.040%)
February Fut Discount -2.6 (Increased by 5.9 points)
February Fut Open Interest Change: -1.15%
February Fut Volume Change: 21.45%
February Fut Open Interest Analysis: Short Covering
MIDCPNIFTY MARCH Future closed at: 14018.35 (0.067%)
March Fut Discount 65.55 (Increased by 9.75 points)
March Fut Open Interest Change: 8.55%
March Fut Volume Change: -21.17%
March Fut Open Interest Analysis: Fresh Long
MIDCPNIFTY Monthly Expiry (24/02/2026) Option Analysis
Put-Call Ratio (Open Interest): 1.182 (Decreased from 1.215)
Put-Call Ratio (Volume): 0.983
Max Pain Level: 13750
Maximum CALL Open Interest: 14500
Maximum PUT Open Interest: 13000
Highest CALL Addition: 14000
Highest PUT Addition: 14000
SENSEX Monthly Expiry (26/02/2026) Future
SENSEX Spot closed at: 84,233.64 (-0.048%)
SENSEX Monthly Future closed at: 84,427.95 (-0.101%)
Premium: 194.31 (Decreased by -45.37 points)
Open Interest Change: -8.19%
Volume Change: -12.33%
Open Interest Analysis: Long Covering
SENSEX Weekly Expiry (12/02/2026) Option Analysis
Put-Call Ratio (OI): 0.900 (Decreased from 1.163)
Put-Call Ratio (Volume): 1.120
Max Pain Level: 84200
Maximum CALL OI: 84500
Maximum PUT OI: 84000
Highest CALL Addition: 84500
Highest PUT Addition: 82000
FII & DII Cash Market Activity
FIIs Net BUY: ₹ 943.81 Cr.
DIIs Net SELL: ₹ 125.36 Cr.
FII Derivatives Activity
| FII Trading Stats | 11.02.26 | 10.02.26 | 9.02.26 |
| FII Cash (Provisional Data) | 943.81 | 69.45 | 2,254.64 |
| Index Future Open Interest Long Ratio | 22.14% | 21.69% | 18.96% |
| Index Future Volume Long Ratio | 52.50% | 67.82% | 58.51% |
| Call Option Open Interest Long Ratio | 50.53% | 51.10% | 50.71% |
| Call Option Volume Long Ratio | 49.90% | 49.93% | 50.31% |
| Put Option Open Interest Long Ratio | 58.72% | 61.47% | 58.31% |
| Put Option Volume Long Ratio | 49.63% | 49.72% | 49.87% |
| Stock Future Open Interest Long Ratio | 60.08% | 60.17% | 60.30% |
| Stock Future Volume Long Ratio | 49.34% | 48.43% | 50.84% |
| Index Futures | Fresh Long | Fresh Long | Short Covering |
| Index Options | Fresh Short | Long Covering | Fresh Long |
| Nifty Futures | Fresh Long | Fresh Long | Short Covering |
| Nifty Options | Fresh Short | Long Covering | Fresh Long |
| BankNifty Futures | Fresh Long | Short Covering | Fresh Long |
| BankNifty Options | Fresh Long | Fresh Short | Fresh Short |
| FinNifty Futures | Short Covering | Fresh Long | Fresh Long |
| FinNifty Options | Short Covering | Fresh Short | Fresh Short |
| MidcpNifty Futures | Long Covering | Short Covering | Fresh Short |
| MidcpNifty Options | Fresh Long | Fresh Long | Fresh Short |
| NiftyNxt50 Futures | Fresh Long | Short Covering | Fresh Long |
| NiftyNxt50 Options | Fresh Long | Fresh Long | Fresh Long |
| Stock Futures | Fresh Short | Fresh Short | Fresh Long |
| Stock Options | Fresh Short | Fresh Short | Fresh Short |
Fresh Long: Net Buy with Increase in Open Interest
Fresh Short: Net Sell with Increase in Open Interest
Short Covering: Net Buy with Decrease in Open Interest
Long Covering: Net Sell with Decrease in Open Interest
NSE & BSE Option market Trends : Options Insights
SENSEX Weekly Expiry (12/02/2026)
The SENSEX index closed at 84233.64. The SENSEX weekly expiry for FEBRUARY 12, 2026 has revealed key trends in open interest. The current Put/Call Ratio is at 0.900 against previous 1.163. The 84500CE option holds the maximum open interest, followed by the 85000CE and 84000PE options. Market participants have shown increased interest with significant open interest additions in the 84500CE option, with open interest additions also seen in the 84600CE and 84400CE options. On the other hand, open interest reductions were prominent in the 86900CE, 79000PE, and 87000CE options. Trading volume was highest in the 84000PE option, followed by the 84200PE and 84500CE options, indicating active trading in these strikes.
| SENSEX | Weekly | Expiry: | 12-02-2026 |
| Index Spot | PCR OI | Prev PCR OI | PCR VOL |
| 84233.64 | 0.900 | 1.163 | 1.120 |
| Total Open Interest Change in all CALLs & PUTs: | |||
| Current | Prior | Net Ch | |
| CALL: | 3,62,43,660 | 2,03,13,360 | 1,59,30,300 |
| PUT: | 3,26,10,040 | 2,36,34,180 | 89,75,860 |
| Top CALL Open Interest: | |||
| Strike | OI | OI Change | Volume |
| 84500 | 24,75,180 | 13,41,440 | 12,63,48,980 |
| 85000 | 21,09,780 | 7,47,880 | 6,33,06,140 |
| Top CALL Open Interest addition: | |||
| Strike | OI | OI Change | Volume |
| 84500 | 24,75,180 | 13,41,440 | 12,63,48,980 |
| 84600 | 17,97,260 | 12,37,980 | 7,28,08,400 |
| Top CALL Open Interest reduction: | |||
| Strike | OI | OI Change | Volume |
| 86900 | 1,09,760 | -2,22,540 | 51,06,660 |
| 87000 | 18,70,040 | -84,240 | 1,66,09,900 |
| Top CALL Volume: | |||
| Strike | OI | OI Change | Volume |
| 84500 | 24,75,180 | 13,41,440 | 12,63,48,980 |
| 84300 | 15,60,900 | 8,69,780 | 10,85,91,740 |
| Top PUT Open Interest: | |||
| Strike | OI | OI Change | Volume |
| 84000 | 20,61,560 | 6,21,520 | 14,12,99,180 |
| 82000 | 20,55,660 | 10,37,740 | 1,62,38,840 |
| Top PUT Open Interest addition: | |||
| Strike | OI | OI Change | Volume |
| 82000 | 20,55,660 | 10,37,740 | 1,62,38,840 |
| 83900 | 12,66,960 | 7,85,180 | 7,01,51,320 |
| Top PUT Open Interest reduction: | |||
| Strike | OI | OI Change | Volume |
| 79000 | 6,22,620 | -89,060 | 41,37,660 |
| 80900 | 70,800 | -74,700 | 32,75,280 |
| Top PUT Volume: | |||
| Strike | OI | OI Change | Volume |
| 84000 | 20,61,560 | 6,21,520 | 14,12,99,180 |
| 84200 | 14,47,060 | 7,79,200 | 12,71,95,400 |
NIFTY Weekly Expiry (17/02/2026)
The NIFTY index closed at 25953.85. The NIFTY weekly expiry for FEBRUARY 17, 2026 has revealed key trends in open interest. The current Put/Call Ratio is at 0.891 against previous 1.026. The 26000CE option holds the maximum open interest, followed by the 27000CE and 27500CE options. Market participants have shown increased interest with significant open interest additions in the 26000CE option, with open interest additions also seen in the 27000CE and 24500PE options. On the other hand, open interest reductions were prominent in the 25500CE, 26500PE, and 25000CE options. Trading volume was highest in the 26000CE option, followed by the 25900PE and 26000PE options, indicating active trading in these strikes.
| NIFTY | Weekly | Expiry: | 17-02-2026 |
| Index Spot | PCR OI | Prev PCR OI | PCR VOL |
| 25,953.85 | 0.891 | 1.026 | 1.070 |
| Total Open Interest Change in all CALLs & PUTs: | |||
| Current | Prior | Net Ch | |
| CALL: | 11,32,98,315 | 6,42,58,090 | 4,90,40,225 |
| PUT: | 10,09,74,315 | 6,59,54,915 | 3,50,19,400 |
| Top CALL Open Interest: | |||
| Strike | OI | OI Change | Volume |
| 26,000 | 1,14,35,190 | 55,53,860 | 42,36,441 |
| 27,000 | 94,82,655 | 35,53,550 | 5,92,158 |
| Top CALL Open Interest addition: | |||
| Strike | OI | OI Change | Volume |
| 26,000 | 1,14,35,190 | 55,53,860 | 42,36,441 |
| 27,000 | 94,82,655 | 35,53,550 | 5,92,158 |
| Top CALL Open Interest reduction: | |||
| Strike | OI | OI Change | Volume |
| 25,500 | 6,48,895 | -1,37,605 | 30,692 |
| 25,000 | 2,26,590 | -36,465 | 3,883 |
| Top CALL Volume: | |||
| Strike | OI | OI Change | Volume |
| 26,000 | 1,14,35,190 | 55,53,860 | 42,36,441 |
| 25,950 | 44,97,090 | 26,36,270 | 25,04,212 |
| Top PUT Open Interest: | |||
| Strike | OI | OI Change | Volume |
| 24,500 | 70,56,010 | 34,66,710 | 3,33,138 |
| 25,900 | 61,89,430 | 27,56,585 | 38,28,709 |
| Top PUT Open Interest addition: | |||
| Strike | OI | OI Change | Volume |
| 24,500 | 70,56,010 | 34,66,710 | 3,33,138 |
| 25,900 | 61,89,430 | 27,56,585 | 38,28,709 |
| Top PUT Open Interest reduction: | |||
| Strike | OI | OI Change | Volume |
| 26,500 | 3,42,745 | -53,885 | 19,150 |
| 24,000 | 51,59,960 | -26,845 | 2,63,234 |
| Top PUT Volume: | |||
| Strike | OI | OI Change | Volume |
| 25,900 | 61,89,430 | 27,56,585 | 38,28,709 |
| 26,000 | 59,72,135 | 26,93,405 | 36,66,210 |
NIFTY Monthly Expiry (24/02/2026)
The NIFTY index closed at 25953.85. The NIFTY monthly expiry for FEBRUARY 24, 2026 has revealed key trends in open interest. The current Put/Call Ratio is at 1.184 against previous 1.190. The 26500CE option holds the maximum open interest, followed by the 26000CE and 25500PE options. Market participants have shown increased interest with significant open interest additions in the 26000PE option, with open interest additions also seen in the 26500CE and 26000CE options. On the other hand, open interest reductions were prominent in the 25500PE, 23500PE, and 25400PE options. Trading volume was highest in the 26000CE option, followed by the 26000PE and 26500CE options, indicating active trading in these strikes.
| NIFTY | Monthly | Expiry: | 24-02-2026 |
| Index Spot | PCR OI | Prev PCR OI | PCR VOL |
| 25,953.85 | 1.184 | 1.190 | 1.099 |
| Total Open Interest Change in all CALLs & PUTs: | |||
| Current | Prior | Net Ch | |
| CALL: | 4,79,22,420 | 4,54,85,765 | 24,36,655 |
| PUT: | 5,67,34,665 | 5,41,20,820 | 26,13,845 |
| Top CALL Open Interest: | |||
| Strike | OI | OI Change | Volume |
| 26,500 | 55,82,395 | 4,80,545 | 89,928 |
| 26,000 | 53,81,090 | 4,37,905 | 1,80,887 |
| Top CALL Open Interest addition: | |||
| Strike | OI | OI Change | Volume |
| 26,500 | 55,82,395 | 4,80,545 | 89,928 |
| 26,000 | 53,81,090 | 4,37,905 | 1,80,887 |
| Top CALL Open Interest reduction: | |||
| Strike | OI | OI Change | Volume |
| 26,450 | 3,02,965 | -94,575 | 29,228 |
| 25,800 | 16,35,855 | -66,040 | 33,473 |
| Top CALL Volume: | |||
| Strike | OI | OI Change | Volume |
| 26,000 | 53,81,090 | 4,37,905 | 1,80,887 |
| 26,500 | 55,82,395 | 4,80,545 | 89,928 |
| Top PUT Open Interest: | |||
| Strike | OI | OI Change | Volume |
| 25,500 | 51,28,825 | -2,42,710 | 85,174 |
| 25,000 | 48,88,130 | 1,70,365 | 66,648 |
| Top PUT Open Interest addition: | |||
| Strike | OI | OI Change | Volume |
| 26,000 | 41,73,650 | 5,45,545 | 1,74,423 |
| 25,800 | 23,08,670 | 3,21,100 | 82,202 |
| Top PUT Open Interest reduction: | |||
| Strike | OI | OI Change | Volume |
| 25,500 | 51,28,825 | -2,42,710 | 85,174 |
| 23,500 | 18,25,460 | -1,48,265 | 10,330 |
| Top PUT Volume: | |||
| Strike | OI | OI Change | Volume |
| 26,000 | 41,73,650 | 5,45,545 | 1,74,423 |
| 25,500 | 51,28,825 | -2,42,710 | 85,174 |
BANKNIFTY Monthly Expiry (24/02/2026)
The BANKNIFTY index closed at 60745.35. The BANKNIFTY monthly expiry for FEBRUARY 24, 2026 has revealed key trends in open interest. The current Put/Call Ratio is at 1.127 against previous 1.005. The 60000PE option holds the maximum open interest, followed by the 60000CE and 58000PE options. Market participants have shown increased interest with significant open interest additions in the 60000PE option, with open interest additions also seen in the 60500PE and 60700PE options. On the other hand, open interest reductions were prominent in the 60500CE, 62600CE, and 59800PE options. Trading volume was highest in the 60500PE option, followed by the 60700PE and 60700CE options, indicating active trading in these strikes.
| BANKNIFTY | Monthly | Expiry: | 24-02-2026 |
| Index Spot | PCR OI | Prev PCR OI | PCR VOL |
| 60,745.35 | 1.127 | 1.005 | 1.094 |
| Total Open Interest Change in all CALLs & PUTs: | |||
| Current | Prior | Net Ch | |
| CALL: | 1,34,89,230 | 1,33,92,480 | 96,750 |
| PUT: | 1,52,08,560 | 1,34,54,940 | 17,53,620 |
| Top CALL Open Interest: | |||
| Strike | OI | OI Change | Volume |
| 60,000 | 15,06,450 | 9,540 | 29,791 |
| 61,000 | 8,28,780 | 28,050 | 94,454 |
| Top CALL Open Interest addition: | |||
| Strike | OI | OI Change | Volume |
| 60,800 | 3,52,620 | 57,420 | 77,316 |
| 62,500 | 6,22,710 | 51,480 | 24,271 |
| Top CALL Open Interest reduction: | |||
| Strike | OI | OI Change | Volume |
| 60,500 | 6,63,540 | -31,410 | 1,14,485 |
| 62,600 | 49,320 | -27,600 | 5,427 |
| Top CALL Volume: | |||
| Strike | OI | OI Change | Volume |
| 60,700 | 5,31,960 | 31,560 | 1,31,996 |
| 60,500 | 6,63,540 | -31,410 | 1,14,485 |
| Top PUT Open Interest: | |||
| Strike | OI | OI Change | Volume |
| 60,000 | 22,07,280 | 1,86,600 | 98,107 |
| 58,000 | 9,58,890 | 1,03,110 | 28,258 |
| Top PUT Open Interest addition: | |||
| Strike | OI | OI Change | Volume |
| 60,000 | 22,07,280 | 1,86,600 | 98,107 |
| 60,500 | 8,14,260 | 1,80,270 | 1,52,182 |
| Top PUT Open Interest reduction: | |||
| Strike | OI | OI Change | Volume |
| 59,800 | 1,50,510 | -26,130 | 14,472 |
| 59,500 | 5,11,710 | -12,540 | 31,542 |
| Top PUT Volume: | |||
| Strike | OI | OI Change | Volume |
| 60,500 | 8,14,260 | 1,80,270 | 1,52,182 |
| 60,700 | 5,66,340 | 1,60,440 | 1,45,449 |
MIDCPNIFTY Monthly Expiry (24/02/2026)
The MIDCPNIFTY index closed at 13952.8. The MIDCPNIFTY monthly expiry for FEBRUARY 24, 2026, 2025 has revealed key trends in open interest. The current Put/Call Ratio is at 1.182 against previous 1.215. The 14500CE option holds the maximum open interest, followed by the 13000PE and 14000CE options. Market participants have shown increased interest with significant open interest additions in the 14000CE option, with open interest additions also seen in the 14000PE and 14500CE options. On the other hand, open interest reductions were prominent in the 67500CE, 67000CE, and 72500PE options. Trading volume was highest in the 14000CE option, followed by the 13900PE and 13950CE options, indicating active trading in these strikes.
| MIDCPNIFTY | Monthly | Expiry: | 24-02-2026 |
| Index Spot | PCR OI | Prev PCR OI | PCR VOL |
| 13,952.80 | 1.182 | 1.215 | 0.983 |
| Total Open Interest Change in all CALLs & PUTs: | |||
| Current | Prior | Net Ch | |
| CALL: | 68,60,760 | 65,40,720 | 3,20,040 |
| PUT: | 81,11,760 | 79,49,400 | 1,62,360 |
| Top CALL Open Interest: | |||
| Strike | OI | OI Change | Volume |
| 14,500 | 11,36,400 | 60,360 | 9,764 |
| 14,000 | 7,95,720 | 1,19,400 | 23,806 |
| Top CALL Open Interest addition: | |||
| Strike | OI | OI Change | Volume |
| 14,000 | 7,95,720 | 1,19,400 | 23,806 |
| 14,500 | 11,36,400 | 60,360 | 9,764 |
| Top CALL Open Interest reduction: | |||
| Strike | OI | OI Change | Volume |
| 13,850 | 59,760 | -30,240 | 981 |
| 13,600 | 1,35,960 | -10,560 | 256 |
| Top CALL Volume: | |||
| Strike | OI | OI Change | Volume |
| 14,000 | 7,95,720 | 1,19,400 | 23,806 |
| 13,950 | 1,03,800 | 18,360 | 12,057 |
| Top PUT Open Interest: | |||
| Strike | OI | OI Change | Volume |
| 13,000 | 11,22,600 | 25,560 | 5,167 |
| 13,500 | 4,75,680 | 15,120 | 7,291 |
| Top PUT Open Interest addition: | |||
| Strike | OI | OI Change | Volume |
| 14,000 | 4,36,560 | 1,05,360 | 11,545 |
| 12,000 | 4,67,160 | 47,280 | 960 |
| Top PUT Open Interest reduction: | |||
| Strike | OI | OI Change | Volume |
| 13,200 | 3,07,800 | -45,600 | 4,839 |
| 13,800 | 4,42,680 | -20,040 | 7,442 |
| Top PUT Volume: | |||
| Strike | OI | OI Change | Volume |
| 13,900 | 2,73,960 | 17,400 | 12,805 |
| 14,000 | 4,36,560 | 1,05,360 | 11,545 |
Conclusion: What the NSE & BSE Indices Futures and Options Open Interest Volume Analysis Tells Us
Open Interest Volume Analysis confirms that this is not a breakout market yet—it is a market of controlled risk-taking and selective conviction.
NIFTY shows fresh long buildup, but heavy CALL OI and declining volumes warn traders to avoid chasing upside beyond 26000 unless volumes expand decisively.
BANKNIFTY stands out as relatively stronger, with rollover-driven strength and improving PCR—making it the better candidate for buy-on-dips rather than index-wide longs.
MIDCPNIFTY remains vulnerable, as long covering and option data suggest mean reversion trades are safer than directional bets.
SENSEX derivative data is a red flag—long unwinding with falling premiums typically precedes either consolidation or corrective phases, not rallies.
Actionable takeaway:
Positional traders should respect option writers’ zones (Max Pain & OI walls)
Intraday traders should trade with futures OI direction, not spot noise
Swing traders must wait for volume confirmation, especially in NIFTY.
Until volumes expand meaningfully, Open Interest Volume Analysis favors disciplined, level-based trading—not emotional positioning.
Check Previous Day’s NSE & BSE Indices F&O Analysis
FII / FPI trading activity in Capital Market Segment
NSE Derivatives Raw Data
BSE Derivatives Raw Data
Disclaimer
fnodata.com is a financial blog providing research-based data and analysis. The content creator of the fnodata.com is not a SEBI registered Investment Advisor. The content on this blog is for informational purposes only and should not be considered as investment advice. You are responsible for your own investment decisions. You should consult with a financial advisor or conduct your own research before making any investment decisions.
[…] Check Previous Day’s NSE & BSE Indices F&O Analysis […]