Turning Complex Derivative Data into Clear Market Insights

NSE & BSE Indices Futures and Options Open Interest Volume Analysis for 4/03/2026
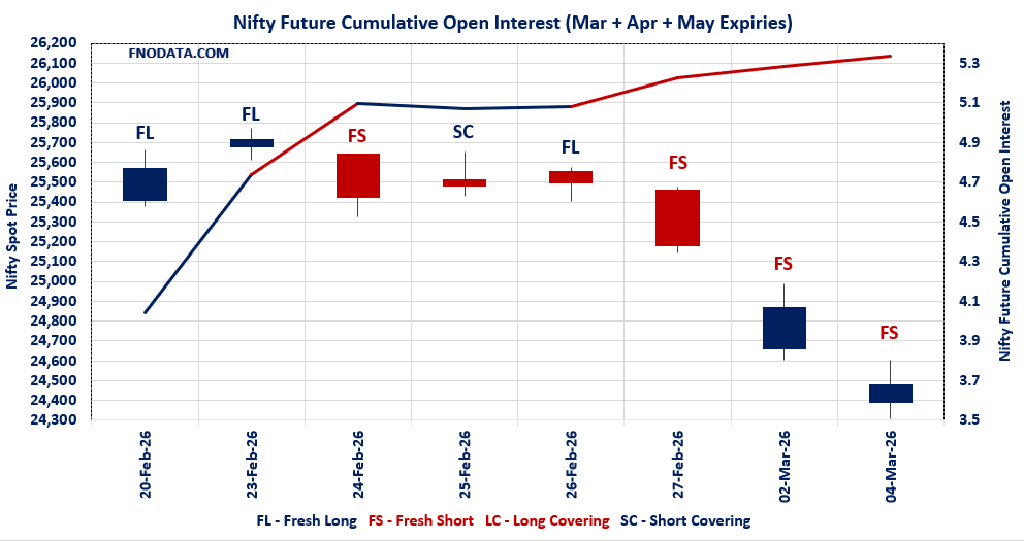
Table of Contents
oday’s Open Interest Volume Analysis across index derivatives clearly reflects aggressive short build-up across large-cap indices, indicating that traders are positioning for continued downside pressure in the near term. Both NIFTY and BANKNIFTY futures witnessed a sharp rise in open interest along with falling prices, which is a classic signal of fresh short creation by institutional participants.
In NIFTY futures, combined open interest increased 5.20% while price declined sharply by 1.55%, confirming that sellers dominated the session. The rise in March and April futures OI with falling premiums further reinforces the bearish undertone, suggesting that traders are actively rolling forward short positions rather than covering them.
The option chain structure also aligns with this bearish bias. Weekly expiry data shows heavy call writing at 25000 and above, while the highest PUT addition appeared at 23100, signaling that option writers expect the index to remain under pressure with a potential trading range forming between 23100–25000 in the short term. The Max Pain level at 24700, which is above the current spot price, indicates that markets may attempt a bounce but selling pressure could emerge at higher levels.
BANKNIFTY derivatives data strengthens the bearish narrative. A massive 19.21% jump in combined futures open interest with a price fall of 1.81% confirms strong fresh short participation by institutional traders. At the same time, aggressive call writing around 59000–61000 levels suggests that traders expect resistance to remain heavy near those levels in the near term.
The MIDCPNIFTY segment presents a slightly different picture, where falling prices accompanied by declining open interest indicate long covering rather than aggressive fresh shorts. This suggests that midcap traders are currently reducing risk exposure instead of initiating large bearish bets, which may lead to comparatively sharper volatility if markets attempt a bounce.
The SENSEX derivatives data also confirms the broader market sentiment, with fresh short positions building in futures despite a rising premium, indicating that traders are hedging and positioning defensively ahead of near-term uncertainty.
Overall, the Open Interest Volume Analysis signals a defensive derivatives positioning across indices, where participants are actively writing calls and initiating shorts while protecting downside levels through selective put additions.
NSE & BSE F&O Market Signals
NIFTY Future analysis
NIFTY Spot closed at: 24480.5 (-1.549%)
Combined = March + April + May
Combined Fut Open Interest Change: 5.20%
Combined Fut Volume Change: 19.02%
Combined Fut Open Interest Analysis: Fresh Short
Rollover: 13% Previous 12%
NIFTY March Future closed at: 24584.7 (-1.591%)
March Fut Premium 104.2 (Decreased by -12.3 points)
March Fut Open Interest Change: 4.50%
March Fut Volume Change: 15.21%
March Fut Open Interest Analysis: Fresh Short
NIFTY April Future closed at: 24741 (-1.588%)
April Fut Premium 260.5 (Decreased by -14 points)
April Fut Open Interest Change: 7.40%
April Fut Volume Change: 59.59%
April Fut Open Interest Analysis: Fresh Short
NIFTY Weekly Expiry (10/03/2026) Option Analysis
Put-Call Ratio (Open Interest): 0.776 (Increased from 0.739)
Put-Call Ratio (Volume): 0.754
Max Pain Level: 24700
Maximum CALL Open Interest: 26000
Maximum PUT Open Interest: 23100
Highest CALL Addition: 25000
Highest PUT Addition: 23100
NIFTY Monthly Expiry (30/03/2026) Option Analysis
Put-Call Ratio (Open Interest): 1.156 (Decreased from 1.182)
Put-Call Ratio (Volume): 0.983
Max Pain Level: 25500
Maximum CALL Open Interest: 26000
Maximum PUT Open Interest: 24000
Highest CALL Addition: 24500
Highest PUT Addition: 23500
BANKNIFTY Future Analysis
BANKNIFTY Spot closed at: 58755.25 (-1.812%)
Combined = March + April + May
Combined Fut Open Interest Change: 19.21%
Combined Fut Volume Change: 5.84%
Combined Fut Open Interest Analysis: Fresh Short
Rollover: 24% Previous 25%
BANKNIFTY MARCH Future closed at: 59100.4 (-1.849%)
March Fut Premium 345.15 (Decreased by -28.8 points)
March Fut Open Interest Change: 21.9%
March Fut Volume Change: 3.9%
March Fut Open Interest Analysis: Fresh Short
BANKNIFTY APRIL Future closed at: 59467.6 (-1.735%)
April Fut Premium 712.35 (Increased by 34.4 points)
April Fut Open Interest Change: 14.18%
April Fut Volume Change: 42.47%
April Fut Open Interest Analysis: Fresh Short
BANKNIFTY Monthly Expiry (30/03/2026) Option Analysis
Put-Call Ratio (Open Interest): 0.902 (Decreased from 1.008)
Put-Call Ratio (Volume): 1.124
Max Pain Level: 60400
Maximum CALL Open Interest: 61000
Maximum PUT Open Interest: 59000
Highest CALL Addition: 59000
Highest PUT Addition: 62000
MIDCPNIFTY Future Analysis
MIDCPNIFTY Spot closed at: 13034.35 (-1.923%)
Combined = March + April + May
Combined Fut Open Interest Change: -2.73%
Combined Fut Volume Change: -10.02%
Combined Fut Open Interest Analysis: Long Covering
Rollover: 3% Previous 3%
MIDCPNIFTY MARCH Future closed at: 13070.65 (-1.923%)
March Fut Premium 36.3 (Decreased by -0.8 points)
March Fut Open Interest Change: -3.15%
March Fut Volume Change: -8.96%
March Fut Open Interest Analysis: Long Covering
MIDCPNIFTY APRIL Future closed at: 13137.75 (-1.993%)
April Fut Premium 103.4 (Decreased by -11.7 points)
April Fut Open Interest Change: 12.48%
April Fut Volume Change: -24.14%
April Fut Open Interest Analysis: Fresh Short
MIDCPNIFTY Monthly Expiry (30/03/2026) Option Analysis
Put-Call Ratio (Open Interest): 0.952 (Decreased from 1.065)
Put-Call Ratio (Volume): 0.984
Max Pain Level: 13425
Maximum CALL Open Interest: 14700
Maximum PUT Open Interest: 12000
Highest CALL Addition: 13000
Highest PUT Addition: 12000
SENSEX Monthly Expiry (25/03/2026) Future
SENSEX Spot closed at: 79,116.19 (-1.399%)
SENSEX Monthly Future closed at: 79,508.85 (-1.329%)
Premium: 392.66 (Increased by 52.11 points)
Open Interest Change: 3.64%
Volume Change: 25.31%
Open Interest Analysis: Fresh Short
SENSEX Weekly Expiry (5/03/2026) Option Analysis
Put-Call Ratio (OI): 1.226 (Increased from 0.937)
Put-Call Ratio (Volume): 0.799
Max Pain Level: 79500
Maximum CALL OI: 82000
Maximum PUT OI: 76000
Highest CALL Addition: 80500
Highest PUT Addition: 74000
FII & DII Cash Market Activity
FIIs Net SELL: ₹ 8,752.65 Cr.
DIIs Net BUY: ₹ 12,068.17 Cr.
FII Derivatives Activity
| FII Trading Stats | 4.03.26 | 2.03.26 | 27.02.26 |
| FII Cash (Provisional Data) | -8,752.65 | -3,295.64 | -7,536.36 |
| Index Future Open Interest Long Ratio | 13.69% | 16.31% | 18.42% |
| Index Future Volume Long Ratio | 37.69% | 32.60% | 23.83% |
| Call Option Open Interest Long Ratio | 46.07% | 46.24% | 47.09% |
| Call Option Volume Long Ratio | 49.86% | 50.04% | 50.01% |
| Put Option Open Interest Long Ratio | 64.35% | 67.65% | 65.65% |
| Put Option Volume Long Ratio | 49.76% | 49.71% | 50.37% |
| Stock Future Open Interest Long Ratio | 59.02% | 59.08% | 59.11% |
| Stock Future Volume Long Ratio | 49.21% | 50.26% | 47.74% |
| Index Futures | Fresh Short | Fresh Short | Fresh Short |
| Index Options | Fresh Short | Long Covering | Fresh Long |
| Nifty Futures | Fresh Short | Fresh Short | Fresh Short |
| Nifty Options | Fresh Short | Long Covering | Fresh Long |
| BankNifty Futures | Long Covering | Fresh Short | Long Covering |
| BankNifty Options | Fresh Short | Fresh Long | Fresh Long |
| FinNifty Futures | Fresh Long | Fresh Long | Long Covering |
| FinNifty Options | Short Covering | Fresh Short | Fresh Short |
| MidcpNifty Futures | Short Covering | Fresh Short | Long Covering |
| MidcpNifty Options | Fresh Short | Fresh Short | Fresh Short |
| NiftyNxt50 Futures | Long Covering | Long Covering | Long Covering |
| NiftyNxt50 Options | Fresh Long | Fresh Long | Fresh Long |
| Stock Futures | Long Covering | Short Covering | Long Covering |
| Stock Options | Fresh Long | Fresh Long | Fresh Short |
Fresh Long: Net Buy with Increase in Open Interest
Fresh Short: Net Sell with Increase in Open Interest
Short Covering: Net Buy with Decrease in Open Interest
Long Covering: Net Sell with Decrease in Open Interest
NSE & BSE Option market Trends : Options Insights
SENSEX weekly Expiry (5/03/2026)
The SENSEX index closed at 79116.19. The SENSEX weekly expiry for MARCH 5, 2026 has revealed key trends in open interest. The current Put/Call Ratio is at 1.226 against previous 0.937. The 76000PE option holds the maximum open interest, followed by the 82000CE and 74000PE options. Market participants have shown increased interest with significant open interest additions in the 74000PE option, with open interest additions also seen in the 76000PE and 75000PE options. On the other hand, open interest reductions were prominent in the 83500CE, 93000CE, and 80000PE options. Trading volume was highest in the 80000CE option, followed by the 81000CE and 80500CE options, indicating active trading in these strikes.
| SENSEX | Weekly | Expiry: | 05-03-2026 |
| Index Spot | PCR OI | Prev PCR OI | PCR VOL |
| 79116.19 | 1.226 | 0.937 | 0.799 |
| Total Open Interest Change in all CALLs & PUTs: | |||
| Current | Prior | Net Ch | |
| CALL: | 2,97,82,960 | 1,99,66,420 | 98,16,540 |
| PUT: | 3,65,16,960 | 1,87,06,220 | 1,78,10,740 |
| Top CALL Open Interest: | |||
| Strike | OI | OI Change | Volume |
| 82000 | 21,63,400 | 7,30,720 | 3,71,37,980 |
| 83000 | 17,76,280 | 3,80,000 | 1,93,94,380 |
| Top CALL Open Interest addition: | |||
| Strike | OI | OI Change | Volume |
| 80500 | 15,29,000 | 11,11,560 | 7,32,55,980 |
| 81000 | 15,44,920 | 9,29,820 | 7,68,42,920 |
| Top CALL Open Interest reduction: | |||
| Strike | OI | OI Change | Volume |
| 83500 | 8,50,060 | -3,88,260 | 1,25,14,860 |
| 93000 | 2,93,720 | -3,40,420 | 23,07,520 |
| Top CALL Volume: | |||
| Strike | OI | OI Change | Volume |
| 80000 | 11,61,380 | 8,34,160 | 10,11,71,860 |
| 81000 | 15,44,920 | 9,29,820 | 7,68,42,920 |
| Top PUT Open Interest: | |||
| Strike | OI | OI Change | Volume |
| 76000 | 21,78,980 | 12,16,540 | 3,59,23,460 |
| 74000 | 21,43,340 | 12,20,160 | 2,65,75,340 |
| Top PUT Open Interest addition: | |||
| Strike | OI | OI Change | Volume |
| 74000 | 21,43,340 | 12,20,160 | 2,65,75,340 |
| 76000 | 21,78,980 | 12,16,540 | 3,59,23,460 |
| Top PUT Open Interest reduction: | |||
| Strike | OI | OI Change | Volume |
| 80000 | 2,90,920 | -3,25,460 | 39,84,960 |
| 79800 | 83,060 | -1,91,640 | 12,13,920 |
| Top PUT Volume: | |||
| Strike | OI | OI Change | Volume |
| 78000 | 15,09,580 | 6,79,460 | 6,03,73,880 |
| 78500 | 10,56,300 | 4,04,740 | 5,68,16,080 |
NIFTY Weekly Expiry (10/03/2026)
The NIFTY index closed at 24480.5. The NIFTY weekly expiry for MARCH 10, 2026 has revealed key trends in open interest. The current Put/Call Ratio is at 0.776 against previous 0.739. The 26000CE option holds the maximum open interest, followed by the 25000CE and 23100PE options. Market participants have shown increased interest with significant open interest additions in the 23100PE option, with open interest additions also seen in the 25000CE and 24500CE options. On the other hand, open interest reductions were prominent in the 24800PE, 27200CE, and 24900PE options. Trading volume was highest in the 24400PE option, followed by the 25000CE and 24400CE options, indicating active trading in these strikes.
| NIFTY | Weekly | Expiry: | 10-03-2026 |
| Index Spot | PCR OI | Prev PCR OI | PCR VOL |
| 24,480.50 | 0.776 | 0.739 | 0.754 |
| Total Open Interest Change in all CALLs & PUTs: | |||
| Current | Prior | Net Ch | |
| CALL: | 9,40,36,995 | 6,58,42,270 | 2,81,94,725 |
| PUT: | 7,29,38,320 | 4,86,25,200 | 2,43,13,120 |
| Top CALL Open Interest: | |||
| Strike | OI | OI Change | Volume |
| 26,000 | 73,02,230 | 14,50,735 | 6,53,114 |
| 25,000 | 62,88,490 | 25,75,365 | 20,48,128 |
| Top CALL Open Interest addition: | |||
| Strike | OI | OI Change | Volume |
| 25,000 | 62,88,490 | 25,75,365 | 20,48,128 |
| 24,500 | 31,32,025 | 24,95,740 | 17,71,271 |
| Top CALL Open Interest reduction: | |||
| Strike | OI | OI Change | Volume |
| 27,200 | 14,43,975 | -9,32,620 | 1,52,437 |
| 25,800 | 27,38,970 | -4,07,745 | 4,19,293 |
| Top CALL Volume: | |||
| Strike | OI | OI Change | Volume |
| 25,000 | 62,88,490 | 25,75,365 | 20,48,128 |
| 24,400 | 16,97,540 | 16,41,250 | 19,77,201 |
| Top PUT Open Interest: | |||
| Strike | OI | OI Change | Volume |
| 23,100 | 61,96,970 | 61,96,970 | 8,01,705 |
| 24,000 | 60,58,780 | 18,40,410 | 17,13,168 |
| Top PUT Open Interest addition: | |||
| Strike | OI | OI Change | Volume |
| 23,100 | 61,96,970 | 61,96,970 | 8,01,705 |
| 24,400 | 38,91,485 | 23,62,490 | 25,33,266 |
| Top PUT Open Interest reduction: | |||
| Strike | OI | OI Change | Volume |
| 24,800 | 12,03,475 | -11,18,195 | 1,40,447 |
| 24,900 | 9,85,595 | -8,73,210 | 75,052 |
| Top PUT Volume: | |||
| Strike | OI | OI Change | Volume |
| 24,400 | 38,91,485 | 23,62,490 | 25,33,266 |
| 24,000 | 60,58,780 | 18,40,410 | 17,13,168 |
NIFTY Monthly Expiry (30/03/2026)
The NIFTY index closed at 24480.5. The NIFTY monthly expiry for MARCH 30, 2026 has revealed key trends in open interest. The current Put/Call Ratio is at 1.156 against previous 1.182. The 26000CE option holds the maximum open interest, followed by the 24000PE and 25500CE options. Market participants have shown increased interest with significant open interest additions in the 23500PE option, with open interest additions also seen in the 24500CE and 25000CE options. On the other hand, open interest reductions were prominent in the 25000PE, 25800CE, and 24800PE options. Trading volume was highest in the 24000PE option, followed by the 24500PE and 25000CE options, indicating active trading in these strikes.
| NIFTY | Monthly | Expiry: | 30-03-2026 |
| Index Spot | PCR OI | Prev PCR OI | PCR VOL |
| 24,480.50 | 1.156 | 1.182 | 0.983 |
| Total Open Interest Change in all CALLs & PUTs: | |||
| Current | Prior | Net Ch | |
| CALL: | 5,02,21,175 | 4,69,83,670 | 32,37,505 |
| PUT: | 5,80,49,755 | 5,55,33,350 | 25,16,405 |
| Top CALL Open Interest: | |||
| Strike | OI | OI Change | Volume |
| 26,000 | 64,09,330 | -2,25,245 | 1,28,661 |
| 25,500 | 43,03,715 | 6,73,595 | 1,27,454 |
| Top CALL Open Interest addition: | |||
| Strike | OI | OI Change | Volume |
| 24,500 | 17,39,400 | 11,48,160 | 1,10,849 |
| 25,000 | 36,59,130 | 11,31,575 | 1,43,934 |
| Top CALL Open Interest reduction: | |||
| Strike | OI | OI Change | Volume |
| 25,800 | 16,25,650 | -4,54,610 | 51,197 |
| 26,300 | 10,66,780 | -3,10,830 | 29,432 |
| Top CALL Volume: | |||
| Strike | OI | OI Change | Volume |
| 25,000 | 36,59,130 | 11,31,575 | 1,43,934 |
| 26,000 | 64,09,330 | -2,25,245 | 1,28,661 |
| Top PUT Open Interest: | |||
| Strike | OI | OI Change | Volume |
| 24,000 | 56,54,335 | 3,50,640 | 1,48,715 |
| 25,000 | 42,49,885 | -14,21,060 | 75,474 |
| Top PUT Open Interest addition: | |||
| Strike | OI | OI Change | Volume |
| 23,500 | 29,45,215 | 13,16,900 | 1,01,344 |
| 23,000 | 39,92,310 | 7,59,020 | 1,14,191 |
| Top PUT Open Interest reduction: | |||
| Strike | OI | OI Change | Volume |
| 25,000 | 42,49,885 | -14,21,060 | 75,474 |
| 24,800 | 6,53,900 | -3,23,440 | 18,835 |
| Top PUT Volume: | |||
| Strike | OI | OI Change | Volume |
| 24,000 | 56,54,335 | 3,50,640 | 1,48,715 |
| 24,500 | 33,05,835 | -1,88,045 | 1,44,244 |
BANKNIFTY Monthly Expiry (30/03/2026)
The BANKNIFTY index closed at 58755.25. The BANKNIFTY monthly expiry for MARCH 30, 2026 has revealed key trends in open interest. The current Put/Call Ratio is at 0.902 against previous 1.008. The 61000CE option holds the maximum open interest, followed by the 62000CE and 59000PE options. Market participants have shown increased interest with significant open interest additions in the 59000CE option, with open interest additions also seen in the 62000PE and 59000PE options. On the other hand, open interest reductions were prominent in the 61000PE, 60000PE, and 59500PE options. Trading volume was highest in the 59000PE option, followed by the 58500PE and 61000CE options, indicating active trading in these strikes.
| BANKNIFTY | Monthly | Expiry: | 30-03-2026 |
| Index Spot | PCR OI | Prev PCR OI | PCR VOL |
| 58,755.25 | 0.902 | 1.008 | 1.124 |
| Total Open Interest Change in all CALLs & PUTs: | |||
| Current | Prior | Net Ch | |
| CALL: | 1,23,75,395 | 1,03,65,595 | 20,09,800 |
| PUT: | 1,11,62,245 | 1,04,49,155 | 7,13,090 |
| Top CALL Open Interest: | |||
| Strike | OI | OI Change | Volume |
| 61,000 | 13,28,520 | 57,120 | 1,01,557 |
| 62,000 | 11,12,790 | 2,25,000 | 76,572 |
| Top CALL Open Interest addition: | |||
| Strike | OI | OI Change | Volume |
| 59,000 | 5,76,570 | 4,77,540 | 93,054 |
| 62,000 | 11,12,790 | 2,25,000 | 76,572 |
| Top CALL Open Interest reduction: | |||
| Strike | OI | OI Change | Volume |
| 60,300 | 60,270 | -48,420 | 11,836 |
| 65,000 | 3,91,980 | -35,520 | 23,178 |
| Top CALL Volume: | |||
| Strike | OI | OI Change | Volume |
| 61,000 | 13,28,520 | 57,120 | 1,01,557 |
| 59,000 | 5,76,570 | 4,77,540 | 93,054 |
| Top PUT Open Interest: | |||
| Strike | OI | OI Change | Volume |
| 59,000 | 7,96,290 | 2,72,850 | 1,17,517 |
| 62,000 | 7,79,880 | 3,43,110 | 14,661 |
| Top PUT Open Interest addition: | |||
| Strike | OI | OI Change | Volume |
| 62,000 | 7,79,880 | 3,43,110 | 14,661 |
| 59,000 | 7,96,290 | 2,72,850 | 1,17,517 |
| Top PUT Open Interest reduction: | |||
| Strike | OI | OI Change | Volume |
| 61,000 | 6,64,350 | -4,29,060 | 35,351 |
| 60,000 | 6,55,875 | -3,90,250 | 51,837 |
| Top PUT Volume: | |||
| Strike | OI | OI Change | Volume |
| 59,000 | 7,96,290 | 2,72,850 | 1,17,517 |
| 58,500 | 4,49,610 | 14,850 | 1,02,314 |
MIDCPNIFTY Monthly Expiry (30/03/2026)
The MIDCPNIFTY index closed at 13034.35. The MIDCPNIFTY monthly expiry for MARCH 30, 2026, 2025 has revealed key trends in open interest. The current Put/Call Ratio is at 0.952 against previous 1.065. The 12000PE option holds the maximum open interest, followed by the 14700CE and 13000PE options. Market participants have shown increased interest with significant open interest additions in the 12000PE option, with open interest additions also seen in the 13000CE and 14000CE options. On the other hand, open interest reductions were prominent in the 61000CE, 61000CE, and 61000CE options. Trading volume was highest in the 13000PE option, followed by the 13700CE and 13000CE options, indicating active trading in these strikes.
| MIDCPNIFTY | Monthly | Expiry: | 30-03-2026 |
| Index Spot | PCR OI | Prev PCR OI | PCR VOL |
| 13,034.35 | 0.952 | 1.065 | 0.984 |
| Total Open Interest Change in all CALLs & PUTs: | |||
| Current | Prior | Net Ch | |
| CALL: | 53,72,760 | 47,42,760 | 6,30,000 |
| PUT: | 51,17,520 | 50,52,000 | 65,520 |
| Top CALL Open Interest: | |||
| Strike | OI | OI Change | Volume |
| 14,700 | 6,76,080 | -90,960 | 2,994 |
| 13,500 | 4,81,800 | 47,160 | 10,465 |
| Top CALL Open Interest addition: | |||
| Strike | OI | OI Change | Volume |
| 13,000 | 2,18,880 | 1,38,360 | 13,807 |
| 14,000 | 4,49,040 | 1,18,200 | 12,641 |
| Top CALL Open Interest reduction: | |||
| Strike | OI | OI Change | Volume |
| 14,700 | 6,76,080 | -90,960 | 2,994 |
| 13,900 | 89,280 | -43,440 | 3,061 |
| Top CALL Volume: | |||
| Strike | OI | OI Change | Volume |
| 13,700 | 3,03,240 | 77,160 | 17,485 |
| 13,000 | 2,18,880 | 1,38,360 | 13,807 |
| Top PUT Open Interest: | |||
| Strike | OI | OI Change | Volume |
| 12,000 | 7,05,000 | 1,39,080 | 10,922 |
| 13,000 | 5,57,400 | -2,640 | 24,901 |
| Top PUT Open Interest addition: | |||
| Strike | OI | OI Change | Volume |
| 12,000 | 7,05,000 | 1,39,080 | 10,922 |
| 11,500 | 2,68,200 | 75,840 | 8,424 |
| Top PUT Open Interest reduction: | |||
| Strike | OI | OI Change | Volume |
| 13,500 | 3,27,480 | -1,60,800 | 5,666 |
| 13,300 | 1,21,560 | -1,22,880 | 2,949 |
| Top PUT Volume: | |||
| Strike | OI | OI Change | Volume |
| 13,000 | 5,57,400 | -2,640 | 24,901 |
| 12,000 | 7,05,000 | 1,39,080 | 10,922 |
Conclusion: What the NSE & BSE Indices Futures and Options Open Interest Volume Analysis Tells Us
Summing up this Open Interest Volume Analysis, the derivatives data clearly indicates that market sentiment remains cautious to bearish in the immediate term. Fresh short build-up across NIFTY, BANKNIFTY and SENSEX futures, along with aggressive call writing in higher strikes, suggests that traders are preparing for continued volatility and potential downside extensions.
For NIFTY, the derivatives positioning highlights 24700–25000 as a strong resistance zone, where aggressive call writing is visible. On the downside, 23100–24000 region holds key support due to put positioning, but if selling pressure intensifies, the index could test lower levels quickly because current futures data shows persistent short participation rather than short covering.
BANKNIFTY appears structurally weaker compared to NIFTY, with heavy fresh shorts and strong call writing at 59000–61000, making this zone a crucial supply area. Unless the index decisively reclaims 59000 levels, any bounce is likely to attract fresh selling from derivative traders.
The MIDCPNIFTY long-covering pattern suggests risk reduction rather than aggressive bearish conviction, which means the index may experience sharp short-term swings if broader markets stabilize. However, continued weakness in frontline indices could still drag midcaps lower.
Meanwhile, SENSEX derivatives positioning around the 79500 max pain level indicates a possible short-term magnet level, but sustained movement above it may remain difficult unless short covering emerges in futures.
Actionable trading insight:
Derivative data favors sell-on-rise strategy rather than aggressive bottom fishing.
Traders should watch 24700–24850 zone in NIFTY and 59000 in BANKNIFTY as key resistance levels where option writers are heavily active.
A short covering rally can only emerge if futures open interest starts declining along with price stabilization, which is currently not visible in the data.
In short, the Open Interest Volume Analysis suggests that institutional positioning is still tilted toward downside risk, and until meaningful short covering appears, markets are likely to remain volatile with a bearish bias in the near term.
Check Previous Day’s NSE & BSE Indices F&O Analysis
FII / FPI trading activity in Capital Market Segment
NSE Derivatives Raw Data
BSE Derivatives Raw Data
Disclaimer
fnodata.com is a financial blog providing research-based data and analysis. The content creator of the fnodata.com is not a SEBI registered Investment Advisor. The content on this blog is for informational purposes only and should not be considered as investment advice. You are responsible for your own investment decisions. You should consult with a financial advisor or conduct your own research before making any investment decisions.
[…] Check Previous Day’s NSE & BSE Indices F&O Analysis […]