Turning Complex Derivative Data into Clear Market Insights

NSE & BSE Indices Futures and Options Open Interest Volume Analysis for 18/03/2026
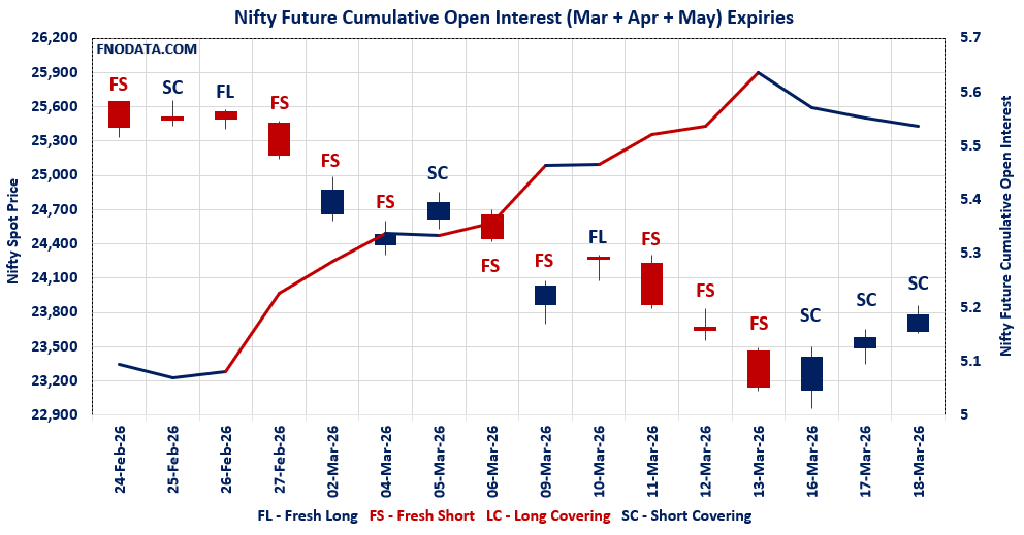
Table of Contents
Today’s Open Interest Volume Analysis clearly reflects a broad-based short covering rally across indices, but the structure underneath is not as clean as it looks on price. NIFTY and SENSEX are seeing consistent unwinding of shorts with declining OI, while BANKNIFTY and MIDCAP are showing selective fresh long build-up, indicating sectoral divergence rather than a uniform bull trend.
The drop in combined futures OI (NIFTY -1.53%) along with price rise confirms short covering, not aggressive long addition, which means this move lacks strong positional conviction. Even volumes have cooled off, suggesting participation is not expanding, a key caution signal in any upmove.
Options data further complicates the picture—despite PCR improving above 1, heavy CALL writing at higher strikes (25000–26000) and clustered PUT writing near 23700–23800 indicate a range-bound expectation with upside supply zones intact.
In BANKNIFTY, the Open Interest Volume Analysis shows a more constructive setup with fresh longs in April, but immediate resistance near 55500–56000 remains active due to aggressive call additions. Meanwhile, MIDCAP strength looks strong on price, but low rollover (7%) and sharp OI spike raise sustainability concerns.
Overall, this Open Interest Volume Analysis suggests a market driven by short covering and selective optimism, not broad-based institutional accumulation, making it vulnerable to sudden reversals near resistance zones.
NSE & BSE F&O Market Signals
NIFTY Future analysis
NIFTY Spot closed at: 23777.8 (0.834%)
Combined = March + April + May
Combined Fut Open Interest Change: -1.53%
Combined Fut Volume Change: -9.46%
Combined Fut Open Interest Analysis: Short Covering
Rollover: 19% Previous 19%
NIFTY March Future closed at: 23776.4 (0.673%)
March Fut Discount -1.4 (Decreased by -37.65 points)
March Fut Open Interest Change: -1.90%
March Fut Volume Change: -9.49%
March Fut Open Interest Analysis: Short Covering
NIFTY April Future closed at: 23922.7 (0.653%)
April Fut Discount 144.9 (Decreased by -41.35 points)
April Fut Open Interest Change: -0.60%
April Fut Volume Change: -8.39%
April Fut Open Interest Analysis: Short Covering
NIFTY Weekly Expiry (24/03/2026) Option Analysis
Put-Call Ratio (Open Interest): 1.060 (Increased from 0.984)
Put-Call Ratio (Volume): 0.743
Max Pain Level: 23700
Maximum CALL Open Interest: 25000
Maximum PUT Open Interest: 21000
Highest CALL Addition: 25200
Highest PUT Addition: 23700
NIFTY Monthly Expiry (30/03/2026) Option Analysis
Put-Call Ratio (Open Interest): 1.177 (Increased from 1.103)
Put-Call Ratio (Volume): 1.063
Max Pain Level: 24500
Maximum CALL Open Interest: 26000
Maximum PUT Open Interest: 19000
Highest CALL Addition: 23800
Highest PUT Addition: 23800
BANKNIFTY Future Analysis
BANKNIFTY Spot closed at: 55326.05 (0.820%)
Combined = March + April + May
Combined Fut Open Interest Change: 0.92%
Combined Fut Volume Change: 10.56%
Combined Fut Open Interest Analysis: Fresh Long
Rollover: 34% Previous 33%
BANKNIFTY MARCH Future closed at: 55416.2 (0.767%)
March Fut Premium 90.15 (Decreased by -28.45 points)
March Fut Open Interest Change: -1.3%
March Fut Volume Change: 6.4%
March Fut Open Interest Analysis: Short Covering
BANKNIFTY APRIL Future closed at: 55794.8 (0.776%)
April Fut Premium 468.75 (Decreased by -20.25 points)
April Fut Open Interest Change: 7.77%
April Fut Volume Change: 50.11%
April Fut Open Interest Analysis: Fresh Long
BANKNIFTY Monthly Expiry (30/03/2026) Option Analysis
Put-Call Ratio (Open Interest): 0.898 (Increased from 0.789)
Put-Call Ratio (Volume): 0.761
Max Pain Level: 57000
Maximum CALL Open Interest: 61000
Maximum PUT Open Interest: 54000
Highest CALL Addition: 55500
Highest PUT Addition: 51500
MIDCPNIFTY Future Analysis
MIDCPNIFTY Spot closed at: 12980.55 (1.918%)
Combined = March + April + May
Combined Fut Open Interest Change: 0.54%
Combined Fut Volume Change: 37.92%
Combined Fut Open Interest Analysis: Fresh Long
Rollover: 7% Previous 6%
MIDCPNIFTY MARCH Future closed at: 12969.9 (1.724%)
March Fut Discount -10.65 (Decreased by -24.4 points)
March Fut Open Interest Change: -0.59%
March Fut Volume Change: 32.93%
March Fut Open Interest Analysis: Short Covering
MIDCPNIFTY APRIL Future closed at: 13030.85 (1.654%)
April Fut Discount 50.3 (Decreased by -32.2 points)
April Fut Open Interest Change: 17.04%
April Fut Volume Change: 89.11%
April Fut Open Interest Analysis: Fresh Long
MIDCPNIFTY Monthly Expiry (30/03/2026) Option Analysis
Put-Call Ratio (Open Interest): 1.146 (Increased from 0.965)
Put-Call Ratio (Volume): 1.115
Max Pain Level: 13000
Maximum CALL Open Interest: 14000
Maximum PUT Open Interest: 12500
Highest CALL Addition: 14000
Highest PUT Addition: 12500
SENSEX Monthly Expiry (25/03/2026) Future
SENSEX Spot closed at: 76,704.13 (0.833%)
SENSEX Monthly Future closed at: 76,739.60 (0.741%)
Premium: 35.47 (Decreased by -68.59 points)
Open Interest Change: -2.79%
Volume Change: 15.61%
Open Interest Analysis: Short Covering
SENSEX Weekly Expiry (19/03/2026) Option Analysis
Put-Call Ratio (OI): 1.347 (Increased from 1.333)
Put-Call Ratio (Volume): 0.911
Max Pain Level: 76500
Maximum CALL OI: 78000
Maximum PUT OI: 74000
Highest CALL Addition: 77300
Highest PUT Addition: 74000
FII & DII Cash Market Activity
FIIs Net SELL: ₹ 2,714.35 Cr.
DIIs Net BUY: ₹ 3,253.03 Cr.
FII Derivatives Activity
| FII Trading Stats | 18.03.26 | 17.03.26 | 16.03.26 |
| FII Cash (Provisional Data) | -2,714.35 | -4,741.22 | -9,365.52 |
| Index Future Open Interest Long Ratio | 14.12% | 12.59% | 11.82% |
| Index Future Volume Long Ratio | 64.65% | 57.31% | 57.23% |
| Call Option Open Interest Long Ratio | 42.70% | 42.50% | 41.79% |
| Call Option Volume Long Ratio | 49.90% | 50.15% | 50.05% |
| Put Option Open Interest Long Ratio | 62.62% | 64.75% | 62.23% |
| Put Option Volume Long Ratio | 49.85% | 49.77% | 49.89% |
| Stock Future Open Interest Long Ratio | 58.08% | 58.35% | 58.48% |
| Stock Future Volume Long Ratio | 47.21% | 48.96% | 50.38% |
| Index Futures | Short Covering | Short Covering | Fresh Long |
| Index Options | Fresh Short | Long Covering | Long Covering |
| Nifty Futures | Short Covering | Short Covering | Short Covering |
| Nifty Options | Fresh Short | Long Covering | Long Covering |
| BankNifty Futures | Fresh Long | Short Covering | Fresh Long |
| BankNifty Options | Fresh Long | Fresh Short | Fresh Long |
| FinNifty Futures | Long Covering | Long Covering | Fresh Long |
| FinNifty Options | Fresh Long | Fresh Long | Fresh Short |
| MidcpNifty Futures | Fresh Long | Fresh Short | Fresh Short |
| MidcpNifty Options | Fresh Long | Fresh Long | Fresh Short |
| NiftyNxt50 Futures | Fresh Short | Fresh Short | Fresh Short |
| NiftyNxt50 Options | Fresh Long | Long Covering | Fresh Long |
| Stock Futures | Fresh Short | Fresh Short | Fresh Long |
| Stock Options | Fresh Short | Fresh Short | Fresh Short |
Fresh Long: Net Buy with Increase in Open Interest
Fresh Short: Net Sell with Increase in Open Interest
Short Covering: Net Buy with Decrease in Open Interest
Long Covering: Net Sell with Decrease in Open Interest
NSE & BSE Option market Trends : Options Insights
SENSEX weekly Expiry (19/03/2026)
The SENSEX index closed at 76704.13. The SENSEX weekly expiry for MARCH 19, 2026 has revealed key trends in open interest. The current Put/Call Ratio is at 1.347 against previous 1.333. The 74000PE option holds the maximum open interest, followed by the 73000PE and 75000PE options. Market participants have shown increased interest with significant open interest additions in the 74000PE option, with open interest additions also seen in the 75000PE and 76000PE options. On the other hand, open interest reductions were prominent in the 71000PE, 74300PE, and 76000CE options. Trading volume was highest in the 77000CE option, followed by the 78000CE and 76000PE options, indicating active trading in these strikes.
| SENSEX | Weekly | Expiry: | 19-03-2026 |
| Index Spot | PCR OI | Prev PCR OI | PCR VOL |
| 76704.13 | 1.347 | 1.333 | 0.911 |
| Total Open Interest Change in all CALLs & PUTs: | |||
| Current | Prior | Net Ch | |
| CALL: | 2,62,39,140 | 1,59,14,880 | 1,03,24,260 |
| PUT: | 3,53,47,480 | 2,12,21,660 | 1,41,25,820 |
| Top CALL Open Interest: | |||
| Strike | OI | OI Change | Volume |
| 78000 | 16,35,160 | 5,60,820 | 9,41,27,440 |
| 79000 | 15,78,940 | 5,69,900 | 2,81,38,300 |
| Top CALL Open Interest addition: | |||
| Strike | OI | OI Change | Volume |
| 77300 | 9,07,860 | 7,46,660 | 4,24,89,540 |
| 77000 | 13,67,980 | 6,72,220 | 11,00,98,240 |
| Top CALL Open Interest reduction: | |||
| Strike | OI | OI Change | Volume |
| 76000 | 5,09,740 | -1,91,940 | 93,76,860 |
| 76200 | 85,360 | -1,80,360 | 84,40,880 |
| Top CALL Volume: | |||
| Strike | OI | OI Change | Volume |
| 77000 | 13,67,980 | 6,72,220 | 11,00,98,240 |
| 78000 | 16,35,160 | 5,60,820 | 9,41,27,440 |
| Top PUT Open Interest: | |||
| Strike | OI | OI Change | Volume |
| 74000 | 25,44,780 | 18,30,060 | 3,07,30,360 |
| 73000 | 19,02,420 | 6,07,060 | 2,80,21,900 |
| Top PUT Open Interest addition: | |||
| Strike | OI | OI Change | Volume |
| 74000 | 25,44,780 | 18,30,060 | 3,07,30,360 |
| 75000 | 17,63,100 | 11,13,440 | 5,51,00,080 |
| Top PUT Open Interest reduction: | |||
| Strike | OI | OI Change | Volume |
| 71000 | 7,60,800 | -4,52,880 | 1,40,34,740 |
| 74300 | 2,45,820 | -3,99,100 | 94,42,620 |
| Top PUT Volume: | |||
| Strike | OI | OI Change | Volume |
| 76000 | 17,29,180 | 10,41,320 | 9,20,04,960 |
| 76500 | 9,81,760 | 8,68,960 | 7,73,74,080 |
NIFTY Weekly Expiry (24/03/2026)
The NIFTY index closed at 23777.8. The NIFTY weekly expiry for MARCH 24, 2026 has revealed key trends in open interest. The current Put/Call Ratio is at 1.060 against previous 0.984. The 21000PE option holds the maximum open interest, followed by the 25000CE and 23000PE options. Market participants have shown increased interest with significant open interest additions in the 23700PE option, with open interest additions also seen in the 23800PE and 23500PE options. On the other hand, open interest reductions were prominent in the 23500CE, 22600PE, and 23400CE options. Trading volume was highest in the 23800CE option, followed by the 24000CE and 23700PE options, indicating active trading in these strikes.
| NIFTY | Weekly | Expiry: | 24-03-2026 |
| Index Spot | PCR OI | Prev PCR OI | PCR VOL |
| 23,777.80 | 1.060 | 0.984 | 0.743 |
| Total Open Interest Change in all CALLs & PUTs: | |||
| Current | Prior | Net Ch | |
| CALL: | 8,48,03,680 | 5,82,77,765 | 2,65,25,915 |
| PUT: | 8,99,21,325 | 5,73,62,825 | 3,25,58,500 |
| Top CALL Open Interest: | |||
| Strike | OI | OI Change | Volume |
| 25,000 | 68,30,200 | 17,70,080 | 7,38,355 |
| 24,500 | 43,88,280 | 14,82,390 | 10,26,545 |
| Top CALL Open Interest addition: | |||
| Strike | OI | OI Change | Volume |
| 25,200 | 31,28,515 | 19,61,700 | 3,13,233 |
| 25,000 | 68,30,200 | 17,70,080 | 7,38,355 |
| Top CALL Open Interest reduction: | |||
| Strike | OI | OI Change | Volume |
| 23,500 | 14,96,560 | -8,13,280 | 3,03,720 |
| 23,400 | 6,37,325 | -3,23,895 | 69,588 |
| Top CALL Volume: | |||
| Strike | OI | OI Change | Volume |
| 23,800 | 33,98,330 | 17,69,495 | 29,00,923 |
| 24,000 | 43,45,510 | 7,11,230 | 24,10,863 |
| Top PUT Open Interest: | |||
| Strike | OI | OI Change | Volume |
| 21,000 | 72,85,785 | 8,81,855 | 4,08,441 |
| 23,000 | 54,98,480 | 13,62,855 | 7,83,763 |
| Top PUT Open Interest addition: | |||
| Strike | OI | OI Change | Volume |
| 23,700 | 36,26,025 | 30,45,835 | 22,84,039 |
| 23,800 | 31,50,615 | 25,75,365 | 19,76,437 |
| Top PUT Open Interest reduction: | |||
| Strike | OI | OI Change | Volume |
| 22,600 | 11,82,155 | -3,75,700 | 2,49,988 |
| 21,700 | 7,21,045 | -1,84,210 | 1,26,144 |
| Top PUT Volume: | |||
| Strike | OI | OI Change | Volume |
| 23,700 | 36,26,025 | 30,45,835 | 22,84,039 |
| 23,800 | 31,50,615 | 25,75,365 | 19,76,437 |
NIFTY Monthly Expiry (30/03/2026)
The NIFTY index closed at 23777.8. The NIFTY monthly expiry for MARCH 30, 2026 has revealed key trends in open interest. The current Put/Call Ratio is at 1.177 against previous 1.103. The 26000CE option holds the maximum open interest, followed by the 19000PE and 23000PE options. Market participants have shown increased interest with significant open interest additions in the 23800PE option, with open interest additions also seen in the 22800PE and 23800CE options. On the other hand, open interest reductions were prominent in the 23500CE, 26000CE, and 22000PE options. Trading volume was highest in the 23000PE option, followed by the 24000CE and 24500CE options, indicating active trading in these strikes.
| NIFTY | Monthly | Expiry: | 30-03-2026 |
| Index Spot | PCR OI | Prev PCR OI | PCR VOL |
| 23,777.80 | 1.177 | 1.103 | 1.063 |
| Total Open Interest Change in all CALLs & PUTs: | |||
| Current | Prior | Net Ch | |
| CALL: | 6,53,44,075 | 6,24,41,520 | 29,02,555 |
| PUT: | 7,68,93,865 | 6,88,95,870 | 79,97,995 |
| Top CALL Open Interest: | |||
| Strike | OI | OI Change | Volume |
| 26,000 | 58,68,275 | -1,56,485 | 37,354 |
| 25,000 | 51,63,980 | 1,89,875 | 93,502 |
| Top CALL Open Interest addition: | |||
| Strike | OI | OI Change | Volume |
| 23,800 | 16,81,095 | 7,69,340 | 92,039 |
| 24,500 | 40,00,490 | 4,09,240 | 1,31,000 |
| Top CALL Open Interest reduction: | |||
| Strike | OI | OI Change | Volume |
| 23,500 | 20,13,960 | -3,10,115 | 48,803 |
| 26,000 | 58,68,275 | -1,56,485 | 37,354 |
| Top CALL Volume: | |||
| Strike | OI | OI Change | Volume |
| 24,000 | 42,52,990 | -25,290 | 1,34,567 |
| 24,500 | 40,00,490 | 4,09,240 | 1,31,000 |
| Top PUT Open Interest: | |||
| Strike | OI | OI Change | Volume |
| 19,000 | 54,57,020 | 5,53,555 | 49,676 |
| 23,000 | 53,39,645 | 3,40,385 | 1,39,620 |
| Top PUT Open Interest addition: | |||
| Strike | OI | OI Change | Volume |
| 23,800 | 21,20,625 | 12,25,055 | 98,933 |
| 22,800 | 14,41,440 | 7,98,070 | 53,804 |
| Top PUT Open Interest reduction: | |||
| Strike | OI | OI Change | Volume |
| 22,000 | 42,94,120 | -1,49,640 | 82,172 |
| 24,200 | 5,35,535 | -1,26,425 | 8,161 |
| Top PUT Volume: | |||
| Strike | OI | OI Change | Volume |
| 23,000 | 53,39,645 | 3,40,385 | 1,39,620 |
| 23,500 | 37,26,840 | 4,96,015 | 1,29,132 |
BANKNIFTY Monthly Expiry (30/03/2026)
The BANKNIFTY index closed at 55326.05. The BANKNIFTY monthly expiry for MARCH 30, 2026 has revealed key trends in open interest. The current Put/Call Ratio is at 0.898 against previous 0.789. The 61000CE option holds the maximum open interest, followed by the 60000CE and 59000CE options. Market participants have shown increased interest with significant open interest additions in the 51500PE option, with open interest additions also seen in the 55000PE and 54000PE options. On the other hand, open interest reductions were prominent in the 51000PE, 59000CE, and 61000CE options. Trading volume was highest in the 55000CE option, followed by the 55000PE and 56000CE options, indicating active trading in these strikes.
| BANKNIFTY | Monthly | Expiry: | 30-03-2026 |
| Index Spot | PCR OI | Prev PCR OI | PCR VOL |
| 55,326.05 | 0.898 | 0.789 | 0.761 |
| Total Open Interest Change in all CALLs & PUTs: | |||
| Current | Prior | Net Ch | |
| CALL: | 1,75,84,385 | 1,81,73,820 | -5,89,435 |
| PUT: | 1,57,90,575 | 1,43,36,800 | 14,53,775 |
| Top CALL Open Interest: | |||
| Strike | OI | OI Change | Volume |
| 61,000 | 10,95,930 | -59,970 | 38,859 |
| 60,000 | 10,15,400 | -56,880 | 63,827 |
| Top CALL Open Interest addition: | |||
| Strike | OI | OI Change | Volume |
| 55,500 | 3,33,620 | 75,960 | 1,02,286 |
| 58,000 | 7,29,300 | 56,940 | 74,227 |
| Top CALL Open Interest reduction: | |||
| Strike | OI | OI Change | Volume |
| 59,000 | 9,70,800 | -66,870 | 55,697 |
| 61,000 | 10,95,930 | -59,970 | 38,859 |
| Top CALL Volume: | |||
| Strike | OI | OI Change | Volume |
| 55,000 | 6,21,900 | 17,850 | 1,86,278 |
| 56,000 | 7,70,760 | -4,560 | 1,19,526 |
| Top PUT Open Interest: | |||
| Strike | OI | OI Change | Volume |
| 54,000 | 8,20,685 | 1,61,575 | 80,803 |
| 55,000 | 7,30,170 | 1,84,920 | 1,79,654 |
| Top PUT Open Interest addition: | |||
| Strike | OI | OI Change | Volume |
| 51,500 | 5,40,450 | 3,03,300 | 52,733 |
| 55,000 | 7,30,170 | 1,84,920 | 1,79,654 |
| Top PUT Open Interest reduction: | |||
| Strike | OI | OI Change | Volume |
| 51,000 | 7,24,110 | -1,21,920 | 78,906 |
| 49,500 | 3,24,240 | -48,210 | 22,064 |
| Top PUT Volume: | |||
| Strike | OI | OI Change | Volume |
| 55,000 | 7,30,170 | 1,84,920 | 1,79,654 |
| 54,000 | 8,20,685 | 1,61,575 | 80,803 |
MIDCPNIFTY Monthly Expiry (30/03/2026)
The MIDCPNIFTY index closed at 12980.55. The MIDCPNIFTY monthly expiry for MARCH 30, 2026, 2025 has revealed key trends in open interest. The current Put/Call Ratio is at 1.146 against previous 0.965. The 12500PE option holds the maximum open interest, followed by the 12000PE and 14000CE options. Market participants have shown increased interest with significant open interest additions in the 12500PE option, with open interest additions also seen in the 12900PE and 11400PE options. On the other hand, open interest reductions were prominent in the 66200CE, 65000PE, and 65000CE options. Trading volume was highest in the 12500PE option, followed by the 13000CE and 12800PE options, indicating active trading in these strikes.
| MIDCPNIFTY | Monthly | Expiry: | 30-03-2026 |
| Index Spot | PCR OI | Prev PCR OI | PCR VOL |
| 12,980.55 | 1.146 | 0.965 | 1.115 |
| Total Open Interest Change in all CALLs & PUTs: | |||
| Current | Prior | Net Ch | |
| CALL: | 70,77,600 | 69,78,120 | 99,480 |
| PUT: | 81,08,160 | 67,33,440 | 13,74,720 |
| Top CALL Open Interest: | |||
| Strike | OI | OI Change | Volume |
| 14,000 | 7,01,640 | 63,480 | 4,721 |
| 13,500 | 6,40,920 | 36,480 | 11,667 |
| Top CALL Open Interest addition: | |||
| Strike | OI | OI Change | Volume |
| 14,000 | 7,01,640 | 63,480 | 4,721 |
| 13,000 | 6,05,160 | 60,720 | 19,873 |
| Top CALL Open Interest reduction: | |||
| Strike | OI | OI Change | Volume |
| 12,750 | 49,800 | -82,560 | 1,670 |
| 12,700 | 1,33,440 | -49,560 | 2,104 |
| Top CALL Volume: | |||
| Strike | OI | OI Change | Volume |
| 13,000 | 6,05,160 | 60,720 | 19,873 |
| 13,500 | 6,40,920 | 36,480 | 11,667 |
| Top PUT Open Interest: | |||
| Strike | OI | OI Change | Volume |
| 12,500 | 10,63,440 | 4,39,560 | 21,050 |
| 12,000 | 9,04,200 | 71,760 | 10,627 |
| Top PUT Open Interest addition: | |||
| Strike | OI | OI Change | Volume |
| 12,500 | 10,63,440 | 4,39,560 | 21,050 |
| 12,900 | 2,34,360 | 1,74,720 | 11,195 |
| Top PUT Open Interest reduction: | |||
| Strike | OI | OI Change | Volume |
| 12,700 | 2,33,760 | -61,560 | 8,156 |
| 12,200 | 3,12,720 | -40,680 | 7,622 |
| Top PUT Volume: | |||
| Strike | OI | OI Change | Volume |
| 12,500 | 10,63,440 | 4,39,560 | 21,050 |
| 12,800 | 2,12,520 | 59,280 | 12,810 |
Conclusion: What the NSE & BSE Indices Futures and Options Open Interest Volume Analysis Tells Us
This Open Interest Volume Analysis suggests the market is currently in a relief rally phase rather than a confirmed bullish trend, with short covering dominating NIFTY and SENSEX, while BANKNIFTY and MIDCAP are attempting fresh long-driven breakouts.
However, multiple caution signals remain:
Declining volumes in NIFTY futures → weak follow-through risk
Heavy CALL writing at higher strikes → upside capped zones (25000 NIFTY / 55500–56000 BANKNIFTY)
Max Pain clustering below spot → mean reversion possibility
Premium contraction across futures → reduced bullish aggression
Actionable strategy based on this Open Interest Volume Analysis:
Avoid chasing highs in NIFTY; prefer buy-on-dips near 23700–23650 zone with strict risk control
Watch BANKNIFTY closely—sustained move above 55600 can trigger momentum longs, else expect sideways consolidation
MIDCAP traders should stay cautious—sharp OI build-up with low rollover can unwind quickly
Keep an eye on 23800–24000 zone in NIFTY—this is now a supply zone unless strong long OI addition comes in
Bottom line: trend is fragile. This is a trader’s market, not an investor’s breakout yet, and the next move will depend on whether fresh long addition replaces short covering in the coming sessions.
Check Previous Day’s NSE & BSE Indices F&O Analysis
FII / FPI trading activity in Capital Market Segment
NSE Derivatives Raw Data
BSE Derivatives Raw Data
Disclaimer
fnodata.com is a financial blog providing research-based data and analysis. The content creator of the fnodata.com is not a SEBI registered Investment Advisor. The content on this blog is for informational purposes only and should not be considered as investment advice. You are responsible for your own investment decisions. You should consult with a financial advisor or conduct your own research before making any investment decisions.
[…] Check Previous Day’s NSE & BSE Indices F&O Analysis […]