Turning Complex Derivative Data into Clear Market Insights

NSE & BSE Indices Futures and Options Open Interest Volume Analysis for 13/04/2026

Table of Contents
Today’s Open Interest Volume Analysis for 13 April 2026 indicates a cautious and slightly defensive positioning across India’s key indices — NIFTY, BANKNIFTY, MIDCPNIFTY, and SENSEX. Despite the market closing lower, the derivatives data reveals a clear divergence in trader positioning: fresh short buildup in NIFTY and parts of BANKNIFTY, while long covering dominated MIDCAP and SENSEX futures. This mixed positioning suggests that traders are not aggressively bearish yet but are increasingly hedging downside risks as the indices approach important option cluster zones.
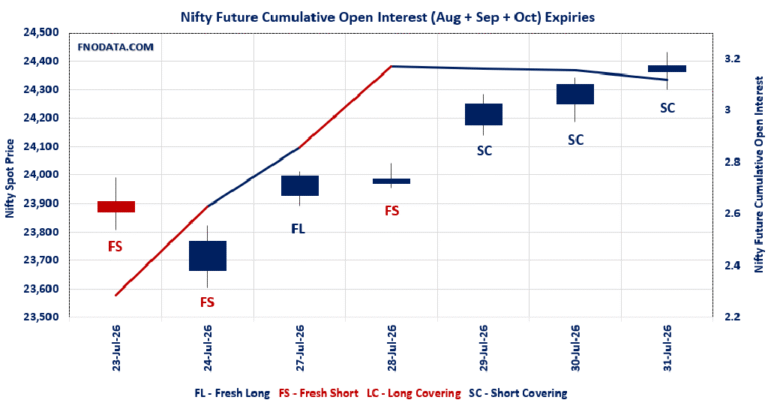
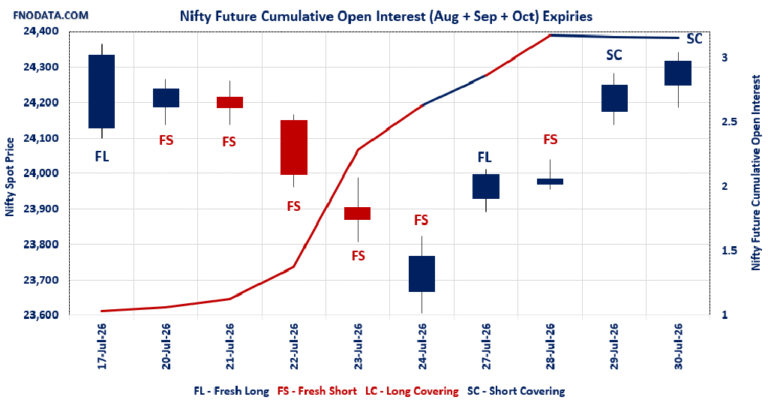
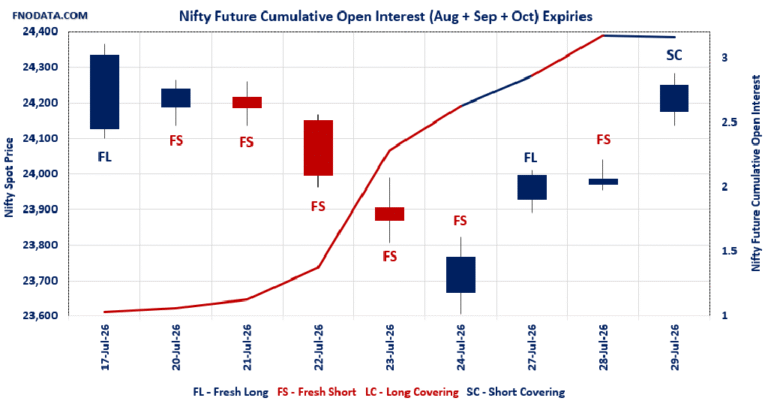
In NIFTY futures, the increase in open interest (+1.04%) with a price decline is a textbook indication of fresh short formation, and this sentiment is reinforced by the sharp collapse in April futures premium by 34 points, showing traders are unwilling to pay forward premiums at current levels. When this Open Interest Volume Analysis is combined with the options data, the market structure becomes clearer — heavy CALL concentration at 25,000 and PUT support at 23,000, with the weekly max pain at 23,800, very close to the current spot level. This positioning indicates that option writers are attempting to pin the market near the 23,800 zone, making it a key magnet level for the coming sessions.
The monthly options structure further confirms a broader 23,000–26,000 range formation, where aggressive call writing at 24,500–26,000 indicates strong overhead supply, while PUT additions at 22,000–23,000 continue to define the lower support base. Importantly, the Put-Call Ratio rising above 1.09 in both weekly and monthly series suggests that traders are adding downside protection rather than aggressively betting on a crash — a subtle but important insight from today’s Open Interest Volume Analysis.
In BANKNIFTY, the derivatives picture is slightly different. The index saw long covering in April futures but fresh short buildup in the May series, signalling a rollover of bearish bets rather than panic selling. The max pain at 55,300 lies just below the current price, suggesting the index may gravitate toward that zone if selling pressure persists. Meanwhile, aggressive call additions at 61,000 and put additions at 54,000 define a broad 54,000–61,000 trading corridor, indicating that institutions are preparing for a wide but controlled range.
The MIDCPNIFTY derivatives data highlights a different trend entirely — consistent long unwinding across futures contracts. This suggests that midcap traders are reducing exposure rather than initiating fresh shorts, often a sign of profit booking after a strong prior rally. The options structure confirms this cooling momentum, with max pain placed at 13,000, nearly 270 points below spot, hinting that derivatives traders are preparing for potential downside drift.
Finally, SENSEX derivatives data also signals long covering, accompanied by a sharp contraction in futures premium. However, the weekly options PCR above 1.35 still reflects strong put positioning, implying that while traders are trimming longs, they continue to maintain downside protection around 76,800, which also coincides with the weekly max pain level. Taken together, this Open Interest Volume Analysis reveals a market entering a short-term consolidation phase with mild bearish bias but strong option-writer control near current levels.
NSE & BSE F&O Market Signals
NIFTY Future analysis
NIFTY Spot closed at: 23842.65 (-0.865%)
Combined = April + May + June
Combined Fut Open Interest Change: 1.04%
Combined Fut Volume Change: -0.16%
Combined Fut Open Interest Analysis: Fresh Short
Rollover: 14% Previous 14%
NIFTY April Future closed at: 23858.7 (-1.005%)
April Fut Premium 16.05 (Decreased by -34.35 points)
April Fut Open Interest Change: 0.59%
April Fut Volume Change: 1.18%
April Fut Open Interest Analysis: Fresh Short
NIFTY MAY Future closed at: 23988.8 (-0.942%)
May Fut Premium 146.15 (Decreased by -20.15 points)
May Fut Open Interest Change: 3.30%
May Fut Volume Change: -13.55%
May Fut Open Interest Analysis: Fresh Short
NIFTY Weekly Expiry (21/04/2026) Option Analysis
Put-Call Ratio (Open Interest): 1.100 (Increased from 0.996)
Put-Call Ratio (Volume): 0.966
Max Pain Level: 23800
Maximum CALL Open Interest: 25000
Maximum PUT Open Interest: 23000
Highest CALL Addition: 25000
Highest PUT Addition: 23000
NIFTY Monthly Expiry (28/04/2026) Option Analysis
Put-Call Ratio (Open Interest): 1.097 (Increased from 1.026)
Put-Call Ratio (Volume): 1.044
Max Pain Level: 24000
Maximum CALL Open Interest: 26000
Maximum PUT Open Interest: 23000
Highest CALL Addition: 24500
Highest PUT Addition: 22000
BANKNIFTY Future Analysis
BANKNIFTY Spot closed at: 55605.05 (-0.550%)
Combined = April + May + June
Combined Fut Open Interest Change: -0.61%
Combined Fut Volume Change: -3.93%
Combined Fut Open Interest Analysis: Long Covering
Rollover: 17% Previous 16%
BANKNIFTY APRIL Future closed at: 55736.8 (-0.607%)
April Fut Premium 131.75 (Decreased by -32.7 points)
April Fut Open Interest Change: -1.5%
April Fut Volume Change: -5.2%
April Fut Open Interest Analysis: Long Covering
BANKNIFTY MAY Future closed at: 55984.2 (-0.550%)
May Fut Premium 379.15 (Decreased by -2.1 points)
May Fut Open Interest Change: 2.92%
May Fut Volume Change: 7.62%
May Fut Open Interest Analysis: Fresh Short
BANKNIFTY Monthly Expiry (28/04/2026) Option Analysis
Put-Call Ratio (Open Interest): 0.916 (Increased from 0.835)
Put-Call Ratio (Volume): 0.722
Max Pain Level: 55300
Maximum CALL Open Interest: 60000
Maximum PUT Open Interest: 58000
Highest CALL Addition: 61000
Highest PUT Addition: 54000
MIDCPNIFTY Future Analysis
MIDCPNIFTY Spot closed at: 13269.45 (-1.021%)
Combined = April + May + June
Combined Fut Open Interest Change: -0.76%
Combined Fut Volume Change: -7.11%
Combined Fut Open Interest Analysis: Long Covering
Rollover: 4% Previous 4%
MIDCPNIFTY APRIL Future closed at: 13273 (-1.169%)
April Fut Premium 3.55 (Decreased by -20.05 points)
April Fut Open Interest Change: -0.80%
April Fut Volume Change: -5.38%
April Fut Open Interest Analysis: Long Covering
MIDCPNIFTY MAY Future closed at: 13305.7 (-1.071%)
May Fut Premium 36.25 (Decreased by -7.15 points)
May Fut Open Interest Change: -0.59%
May Fut Volume Change: -26.54%
May Fut Open Interest Analysis: Long Covering
MIDCPNIFTY Monthly Expiry (28/04/2026) Option Analysis
Put-Call Ratio (Open Interest): 1.201 (Increased from 1.165)
Put-Call Ratio (Volume): 0.883
Max Pain Level: 13000
Maximum CALL Open Interest: 14500
Maximum PUT Open Interest: 12500
Highest CALL Addition: 13300
Highest PUT Addition: 12500
SENSEX Monthly Expiry (30/04/2026) Future
SENSEX Spot closed at: 76,847.57 (-0.906%)
SENSEX Monthly Future closed at: 77,072.30 (-0.971%)
Premium: 224.73 (Decreased by -53.12 points)
Open Interest Change: -0.27%
Volume Change: 39.07%
Open Interest Analysis: Long Covering
SENSEX Weekly Expiry (16/04/2026) Option Analysis
Put-Call Ratio (OI): 1.359 (Decreased from 1.384)
Put-Call Ratio (Volume): 0.905
Max Pain Level: 76800
Maximum CALL OI: 80000
Maximum PUT OI: 72000
Highest CALL Addition: 80000
Highest PUT Addition: 72000
FII & DII Cash Market Activity
FIIs Net SELL: ₹ 1,983.18 Cr.
DIIs Net BUY: ₹ 2,432.30 Cr.
FII Derivatives Activity
| FII Trading Stats | 13.04.26 | 10.04.26 | 9.04.26 |
| FII Cash (Provisional Data) | -1,983.18 | 672.09 | -1,711.19 |
| Index Future Open Interest Long Ratio | 21.82% | 22.06% | 20.48% |
| Index Future Volume Long Ratio | 46.50% | 71.52% | 49.49% |
| Call Option Open Interest Long Ratio | 42.34% | 42.65% | 40.20% |
| Call Option Volume Long Ratio | 49.79% | 50.35% | 49.67% |
| Put Option Open Interest Long Ratio | 64.75% | 61.78% | 63.07% |
| Put Option Volume Long Ratio | 49.65% | 50.01% | 50.48% |
| Stock Future Open Interest Long Ratio | 57.03% | 57.34% | 57.36% |
| Stock Future Volume Long Ratio | 46.46% | 49.79% | 49.39% |
| Index Futures | Long Covering | Short Covering | Long Covering |
| Index Options | Long Covering | Fresh Long | Fresh Long |
| Nifty Futures | Long Covering | Short Covering | Short Covering |
| Nifty Options | Long Covering | Fresh Long | Fresh Long |
| BankNifty Futures | Fresh Short | Fresh Long | Long Covering |
| BankNifty Options | Fresh Long | Fresh Long | Short Covering |
| FinNifty Futures | Short Covering | Fresh Long | Fresh Short |
| FinNifty Options | Fresh Long | Fresh Long | Fresh Long |
| MidcpNifty Futures | Long Covering | Fresh Long | Long Covering |
| MidcpNifty Options | Fresh Long | Fresh Long | Fresh Long |
| NiftyNxt50 Futures | Long Covering | Fresh Short | Short Covering |
| NiftyNxt50 Options | Fresh Long | Short Covering | Fresh Long |
| Stock Futures | Long Covering | Fresh Long | Fresh Short |
| Stock Options | Fresh Short | Fresh Short | Fresh Short |
Fresh Long: Net Buy with Increase in Open Interest
Fresh Short: Net Sell with Increase in Open Interest
Short Covering: Net Buy with Decrease in Open Interest
Long Covering: Net Sell with Decrease in Open Interest
NSE & BSE Option market Trends : Options Insights
SENSEX weekly Expiry (16/04/2026)
The SENSEX index closed at 76847.57. The SENSEX weekly expiry for APRIL 16, 2026 has revealed key trends in open interest. The current Put/Call Ratio is at 1.359 against previous 1.384. The 80000CE option holds the maximum open interest, followed by the 72000PE and 74000PE options. Market participants have shown increased interest with significant open interest additions in the 72000PE option, with open interest additions also seen in the 80000CE and 81000CE options. On the other hand, open interest reductions were prominent in the 77400PE, 77300PE, and 77500PE options. Trading volume was highest in the 76000PE option, followed by the 79000CE and 77000CE options, indicating active trading in these strikes.
| SENSEX | Weekly | Expiry: | 16-04-2026 |
| Index Spot | PCR OI | Prev PCR OI | PCR VOL |
| 76847.57 | 1.359 | 1.384 | 0.905 |
| Total Open Interest Change in all CALLs & PUTs: | |||
| Current | Prior | Net Ch | |
| CALL: | 1,40,45,460 | 73,49,220 | 66,96,240 |
| PUT: | 1,90,89,000 | 1,01,68,700 | 89,20,300 |
| Top CALL Open Interest: | |||
| Strike | OI | OI Change | Volume |
| 80000 | 12,39,020 | 8,35,000 | 1,11,97,280 |
| 81000 | 10,86,800 | 7,28,280 | 67,95,940 |
| Top CALL Open Interest addition: | |||
| Strike | OI | OI Change | Volume |
| 80000 | 12,39,020 | 8,35,000 | 1,11,97,280 |
| 81000 | 10,86,800 | 7,28,280 | 67,95,940 |
| Top CALL Open Interest reduction: | |||
| Strike | OI | OI Change | Volume |
| 83000 | 1,84,940 | -1,67,260 | 17,94,360 |
| 77400 | 1,06,240 | -1,41,640 | 33,52,180 |
| Top CALL Volume: | |||
| Strike | OI | OI Change | Volume |
| 79000 | 7,86,420 | 4,39,420 | 1,19,38,520 |
| 77000 | 4,63,820 | 1,76,440 | 1,13,05,780 |
| Top PUT Open Interest: | |||
| Strike | OI | OI Change | Volume |
| 72000 | 12,19,080 | 8,49,240 | 81,38,140 |
| 74000 | 11,98,100 | 7,03,720 | 82,07,420 |
| Top PUT Open Interest addition: | |||
| Strike | OI | OI Change | Volume |
| 72000 | 12,19,080 | 8,49,240 | 81,38,140 |
| 74000 | 11,98,100 | 7,03,720 | 82,07,420 |
| Top PUT Open Interest reduction: | |||
| Strike | OI | OI Change | Volume |
| 77400 | 61,020 | -2,23,300 | 7,48,240 |
| 77300 | 53,900 | -2,21,840 | 8,71,940 |
| Top PUT Volume: | |||
| Strike | OI | OI Change | Volume |
| 76000 | 6,79,460 | 3,64,580 | 1,19,53,360 |
| 75000 | 8,20,960 | 3,84,020 | 82,68,220 |
NIFTY Weekly Expiry (13/04/2026)
The NIFTY index closed at 23842.65. The NIFTY weekly expiry for APRIL 21, 2026 has revealed key trends in open interest. The current Put/Call Ratio is at 1.100 against previous 0.996. The 25000CE option holds the maximum open interest, followed by the 23000PE and 22000PE options. Market participants have shown increased interest with significant open interest additions in the 23000PE option, with open interest additions also seen in the 25000CE and 22000PE options. On the other hand, open interest reductions were prominent in the 24100PE, 24050PE, and 25700CE options. Trading volume was highest in the 23000PE option, followed by the 24000CE and 25000CE options, indicating active trading in these strikes.
| NIFTY | Weekly | Expiry: | 21-04-2026 |
| Index Spot | PCR OI | Prev PCR OI | PCR VOL |
| 23,842.65 | 1.100 | 0.996 | 0.966 |
| Total Open Interest Change in all CALLs & PUTs: | |||
| Current | Prior | Net Ch | |
| CALL: | 5,02,37,915 | 2,30,40,940 | 2,71,96,975 |
| PUT: | 5,52,71,775 | 2,29,54,035 | 3,23,17,740 |
| Top CALL Open Interest: | |||
| Strike | OI | OI Change | Volume |
| 25,000 | 46,12,010 | 25,00,420 | 2,33,892 |
| 24,500 | 32,27,250 | 17,42,390 | 2,29,804 |
| Top CALL Open Interest addition: | |||
| Strike | OI | OI Change | Volume |
| 25,000 | 46,12,010 | 25,00,420 | 2,33,892 |
| 24,800 | 23,81,730 | 17,56,300 | 1,56,676 |
| Top CALL Open Interest reduction: | |||
| Strike | OI | OI Change | Volume |
| 25,700 | 10,28,820 | -95,355 | 68,000 |
| 23,100 | 59,280 | -4,225 | 1,097 |
| Top CALL Volume: | |||
| Strike | OI | OI Change | Volume |
| 24,000 | 25,53,265 | 13,85,410 | 2,63,338 |
| 25,000 | 46,12,010 | 25,00,420 | 2,33,892 |
| Top PUT Open Interest: | |||
| Strike | OI | OI Change | Volume |
| 23,000 | 42,04,915 | 25,66,330 | 2,84,500 |
| 22,000 | 32,84,840 | 21,18,610 | 1,56,601 |
| Top PUT Open Interest addition: | |||
| Strike | OI | OI Change | Volume |
| 23,000 | 42,04,915 | 25,66,330 | 2,84,500 |
| 22,000 | 32,84,840 | 21,18,610 | 1,56,601 |
| Top PUT Open Interest reduction: | |||
| Strike | OI | OI Change | Volume |
| 24,100 | 1,99,550 | -1,96,430 | 15,536 |
| 24,050 | 51,480 | -96,525 | 5,979 |
| Top PUT Volume: | |||
| Strike | OI | OI Change | Volume |
| 23,000 | 42,04,915 | 25,66,330 | 2,84,500 |
| 23,500 | 25,14,265 | 14,41,570 | 2,14,507 |
NIFTY Monthly Expiry (28/04/2026)
The NIFTY index closed at 23842.65. The NIFTY monthly expiry for APRIL 28, 2026 has revealed key trends in open interest. The current Put/Call Ratio is at 1.097 against previous 1.026. The 23000PE option holds the maximum open interest, followed by the 22000PE and 26000CE options. Market participants have shown increased interest with significant open interest additions in the 22000PE option, with open interest additions also seen in the 22200PE and 22300PE options. On the other hand, open interest reductions were prominent in the 24000PE, 23000CE, and 22400PE options. Trading volume was highest in the 24000CE option, followed by the 24500CE and 25000CE options, indicating active trading in these strikes.
| NIFTY | Monthly | Expiry: | 28-04-2026 |
| Index Spot | PCR OI | Prev PCR OI | PCR VOL |
| 23,842.65 | 1.097 | 1.026 | 1.044 |
| Total Open Interest Change in all CALLs & PUTs: | |||
| Current | Prior | Net Ch | |
| CALL: | 4,98,01,050 | 4,76,11,070 | 21,89,980 |
| PUT: | 5,46,20,345 | 4,88,31,835 | 57,88,510 |
| Top CALL Open Interest: | |||
| Strike | OI | OI Change | Volume |
| 26,000 | 45,35,440 | 2,53,175 | 34,715 |
| 24,000 | 44,46,585 | 35,425 | 1,07,158 |
| Top CALL Open Interest addition: | |||
| Strike | OI | OI Change | Volume |
| 24,500 | 35,39,510 | 5,16,620 | 1,02,414 |
| 23,800 | 9,55,110 | 3,27,925 | 50,485 |
| Top CALL Open Interest reduction: | |||
| Strike | OI | OI Change | Volume |
| 23,000 | 24,19,040 | -1,43,065 | 12,473 |
| 25,000 | 40,29,805 | -1,06,990 | 95,441 |
| Top CALL Volume: | |||
| Strike | OI | OI Change | Volume |
| 24,000 | 44,46,585 | 35,425 | 1,07,158 |
| 24,500 | 35,39,510 | 5,16,620 | 1,02,414 |
| Top PUT Open Interest: | |||
| Strike | OI | OI Change | Volume |
| 23,000 | 49,41,170 | 1,76,540 | 91,284 |
| 22,000 | 47,40,905 | 8,94,400 | 92,590 |
| Top PUT Open Interest addition: | |||
| Strike | OI | OI Change | Volume |
| 22,000 | 47,40,905 | 8,94,400 | 92,590 |
| 22,200 | 10,66,000 | 7,32,615 | 32,277 |
| Top PUT Open Interest reduction: | |||
| Strike | OI | OI Change | Volume |
| 24,000 | 34,53,450 | -2,83,920 | 57,215 |
| 22,400 | 7,54,910 | -1,10,500 | 21,628 |
| Top PUT Volume: | |||
| Strike | OI | OI Change | Volume |
| 22,000 | 47,40,905 | 8,94,400 | 92,590 |
| 23,000 | 49,41,170 | 1,76,540 | 91,284 |
BANKNIFTY Monthly Expiry (28/04/2026)
The BANKNIFTY index closed at 55605.05. The BANKNIFTY monthly expiry for APRIL 28, 2026 has revealed key trends in open interest. The current Put/Call Ratio is at 0.916 against previous 0.835. The 60000CE option holds the maximum open interest, followed by the 58000CE and 58000PE options. Market participants have shown increased interest with significant open interest additions in the 61000CE option, with open interest additions also seen in the 54000PE and 54500PE options. On the other hand, open interest reductions were prominent in the 58000CE, 58000PE, and 52000PE options. Trading volume was highest in the 58000CE option, followed by the 56000CE and 57000CE options, indicating active trading in these strikes.
| BANKNIFTY | Monthly | Expiry: | 28-04-2026 |
| Index Spot | PCR OI | Prev PCR OI | PCR VOL |
| 55,605.05 | 0.916 | 0.835 | 0.722 |
| Total Open Interest Change in all CALLs & PUTs: | |||
| Current | Prior | Net Ch | |
| CALL: | 1,44,21,270 | 1,52,14,230 | -7,92,960 |
| PUT: | 1,32,05,970 | 1,27,08,960 | 4,97,010 |
| Top CALL Open Interest: | |||
| Strike | OI | OI Change | Volume |
| 60,000 | 12,81,570 | -40,110 | 79,371 |
| 58,000 | 8,20,320 | -6,52,950 | 1,20,453 |
| Top CALL Open Interest addition: | |||
| Strike | OI | OI Change | Volume |
| 61,000 | 7,74,450 | 1,17,750 | 42,196 |
| 55,700 | 1,24,830 | 52,890 | 22,604 |
| Top CALL Open Interest reduction: | |||
| Strike | OI | OI Change | Volume |
| 58,000 | 8,20,320 | -6,52,950 | 1,20,453 |
| 62,000 | 3,75,930 | -60,330 | 25,653 |
| Top CALL Volume: | |||
| Strike | OI | OI Change | Volume |
| 58,000 | 8,20,320 | -6,52,950 | 1,20,453 |
| 56,000 | 5,89,950 | -2,130 | 83,441 |
| Top PUT Open Interest: | |||
| Strike | OI | OI Change | Volume |
| 58,000 | 7,86,360 | -1,98,330 | 7,923 |
| 55,000 | 6,94,320 | 14,280 | 74,870 |
| Top PUT Open Interest addition: | |||
| Strike | OI | OI Change | Volume |
| 54,000 | 6,70,350 | 83,760 | 49,552 |
| 54,500 | 3,17,430 | 71,820 | 45,580 |
| Top PUT Open Interest reduction: | |||
| Strike | OI | OI Change | Volume |
| 58,000 | 7,86,360 | -1,98,330 | 7,923 |
| 52,000 | 6,58,650 | -71,130 | 42,573 |
| Top PUT Volume: | |||
| Strike | OI | OI Change | Volume |
| 55,000 | 6,94,320 | 14,280 | 74,870 |
| 54,000 | 6,70,350 | 83,760 | 49,552 |
MIDCPNIFTY Monthly Expiry (28/04/2026)
The MIDCPNIFTY index closed at 13269.45. The MIDCPNIFTY monthly expiry for APRIL 28, 2026, 2025 has revealed key trends in open interest. The current Put/Call Ratio is at 1.201 against previous 1.165. The 12500PE option holds the maximum open interest, followed by the 12000PE and 12900PE options. Market participants have shown increased interest with significant open interest additions in the 12500PE option, with open interest additions also seen in the 11500PE and 13300CE options. On the other hand, open interest reductions were prominent in the 68700PE, 68700PE, and 68700PE options. Trading volume was highest in the 13700CE option, followed by the 13200PE and 14000CE options, indicating active trading in these strikes.
| MIDCPNIFTY | Monthly | Expiry: | 28-04-2026 |
| Index Spot | PCR OI | Prev PCR OI | PCR VOL |
| 13,269.45 | 1.201 | 1.165 | 0.883 |
| Total Open Interest Change in all CALLs & PUTs: | |||
| Current | Prior | Net Ch | |
| CALL: | 42,96,960 | 42,85,200 | 11,760 |
| PUT: | 51,60,480 | 49,93,200 | 1,67,280 |
| Top CALL Open Interest: | |||
| Strike | OI | OI Change | Volume |
| 14,500 | 3,76,680 | -10,560 | 1,857 |
| 14,000 | 3,51,120 | -46,080 | 7,678 |
| Top CALL Open Interest addition: | |||
| Strike | OI | OI Change | Volume |
| 13,300 | 1,59,120 | 40,680 | 5,195 |
| 13,800 | 1,89,480 | 29,160 | 6,940 |
| Top CALL Open Interest reduction: | |||
| Strike | OI | OI Change | Volume |
| 14,000 | 3,51,120 | -46,080 | 7,678 |
| 13,400 | 1,01,640 | -34,320 | 2,506 |
| Top CALL Volume: | |||
| Strike | OI | OI Change | Volume |
| 13,700 | 1,91,760 | -3,480 | 12,351 |
| 14,000 | 3,51,120 | -46,080 | 7,678 |
| Top PUT Open Interest: | |||
| Strike | OI | OI Change | Volume |
| 12,500 | 6,93,240 | 88,440 | 6,023 |
| 12,000 | 5,37,000 | -25,800 | 3,150 |
| Top PUT Open Interest addition: | |||
| Strike | OI | OI Change | Volume |
| 12,500 | 6,93,240 | 88,440 | 6,023 |
| 11,500 | 2,77,920 | 83,760 | 2,365 |
| Top PUT Open Interest reduction: | |||
| Strike | OI | OI Change | Volume |
| 13,500 | 91,800 | -47,880 | 2,889 |
| 13,400 | 72,000 | -36,360 | 1,658 |
| Top PUT Volume: | |||
| Strike | OI | OI Change | Volume |
| 13,200 | 2,03,160 | 4,800 | 7,835 |
| 13,000 | 4,07,760 | 12,720 | 7,207 |
Conclusion: What the NSE & BSE Indices Futures and Options Open Interest Volume Analysis Tells Us
Summarizing the Open Interest Volume Analysis, the derivatives market on 13 April 2026 signals a controlled corrective phase rather than a structural bearish breakdown. The most important insight is the fresh short buildup in NIFTY futures, which confirms increasing downside pressure, but the rising Put-Call Ratio and strong PUT bases across strikes indicate that traders still expect meaningful support at lower levels.
For NIFTY, the 23,800 max pain level combined with strong option activity suggests that this zone could act as the near-term equilibrium point, while 23,000 remains the major positional support. On the upside, 24,500–25,000 call clusters are likely to act as strong resistance where option writers may continue defending positions.
BANKNIFTY’s derivative structure indicates a gradual rollover into fresh shorts, suggesting the index may remain volatile within the 54,000–61,000 option corridor, with 55,300 acting as the immediate magnet level.
The MIDCPNIFTY and SENSEX futures data, dominated by long covering rather than aggressive shorts, hints that broader market weakness may remain corrective rather than panic-driven, particularly if institutional buying reappears near major option support zones.
From a trader’s perspective, today’s Open Interest Volume Analysis suggests adopting a range-trading approach with a cautious bearish bias. Unless NIFTY decisively reclaims the 24,200–24,300 zone, the derivatives structure favors sideways-to-down consolidation, where option writers remain firmly in control of market direction.
Check Previous Day’s NSE & BSE Indices F&O Analysis
FII / FPI trading activity in Capital Market Segment
NSE Derivatives Raw Data
BSE Derivatives Raw Data
Disclaimer
fnodata.com is a financial blog providing research-based data and analysis. The content creator of the fnodata.com is not a SEBI registered Investment Advisor. The content on this blog is for informational purposes only and should not be considered as investment advice. You are responsible for your own investment decisions. You should consult with a financial advisor or conduct your own research before making any investment decisions.