Turning Complex Derivative Data into Clear Market Insights

NSE & BSE Indices Futures and Options Open Interest Volume Analysis for 15/07/2026

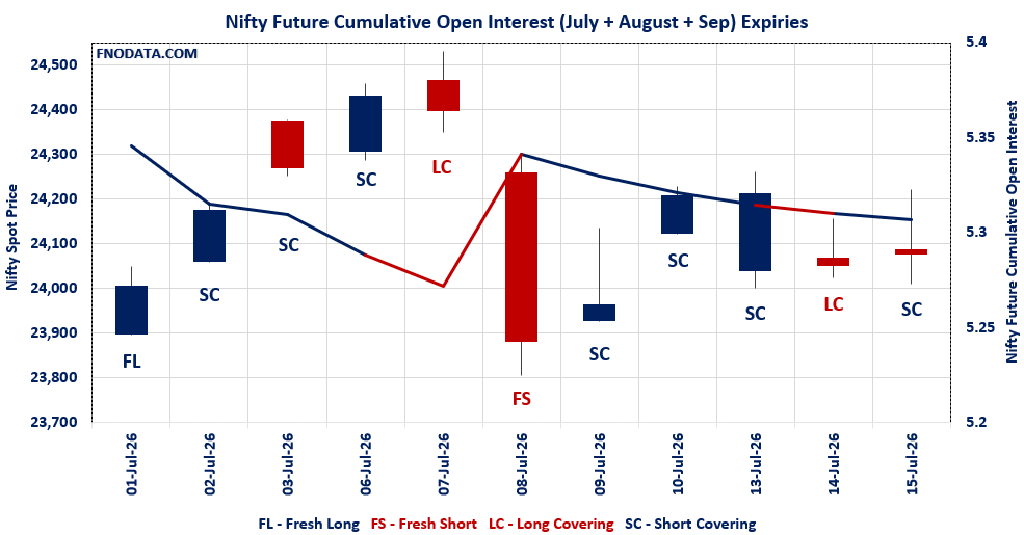
Table of Contents
Welcome back, traders! If you’ve been tracking the markets today, you already know the markets are subtly shifting gears. Our deep Open Interest Volume Analysis for the mid-July series reveals one dominant theme across the board: aggressive short covering in the current month coupled with confident fresh longs rolling into August. The bears are quietly unwinding their positions, but the options chain suggests we might face some near-term speed bumps before any massive breakout. Here is the big-picture breakdown of what the raw data is screaming at us:
The Bears Are Retreating: Across NIFTY, BANKNIFTY, MIDCPNIFTY, and SENSEX, July futures universally saw a drop in both open interest and volume alongside rising spot prices. This is textbook short covering—sellers are feeling the heat and buying back their positions.
August is Catching the Bids: Smart money isn’t just closing shorts; they are rolling long. Nifty and BankNifty August futures are seeing fresh long additions, while Midcap Nifty is the clear outperformer with a massive 12.36% spike in August OI.
The Expiry Tug-of-War: We are seeing a classic divergence in timelines. Weekly option writers are cautious and slightly bearish (Nifty weekly Put-Call Ratio dropping to 0.776), but the monthly writers are boldly bullish, pushing the monthly PCR up to 1.080.
NSE & BSE F&O Market Signals
NIFTY Future analysis
NIFTY Spot closed at: 24078.5 (0.110%)
Combined = July + August + September
Combined Fut Open Interest Change: -0.33%
Combined Fut Volume Change: -9.37%
Combined Fut Open Interest Analysis: Short Covering
Rollover: 13% Previous 12%
NIFTY JULY Future closed at: 24067.8 (0.181%)
July Fut Discount -10.7 (Increased by 17.15 points)
July Fut Open Interest Change: -0.58%
July Fut Volume Change: -10.28%
July Fut Open Interest Analysis: Short Covering
NIFTY AUGUST Future closed at: 24167.6 (0.197%)
Aug Fut Discount 89.1 (Increased by 21.15 points)
Aug Fut Open Interest Change: 1.65%
Aug Fut Volume Change: -4.41%
Aug Fut Open Interest Analysis: Fresh Long
NIFTY Weekly Expiry (21/07/2026) Option Analysis
Put-Call Ratio (Open Interest): 0.776 (Decreased from 0.859)
Put-Call Ratio (Volume): 0.994
Max Pain Level: 24100
Maximum CALL Open Interest: 24200
Maximum PUT Open Interest: 23000
Highest CALL Addition: 24200
Highest PUT Addition: 23000
NIFTY Monthly Expiry (28/07/2026) Option Analysis
Put-Call Ratio (Open Interest): 1.080 (Increased from 1.062)
Put-Call Ratio (Volume): 0.954
Max Pain Level: 24200
Maximum CALL Open Interest: 25000
Maximum PUT Open Interest: 24000
Highest CALL Addition: 24200
Highest PUT Addition: 24100
BANKNIFTY Future Analysis
BANKNIFTY Spot closed at: 57757.85 (0.514%)
Combined = July + August + September
Combined Fut Open Interest Change: -2.01%
Combined Fut Volume Change: -1.12%
Combined Fut Open Interest Analysis: Short Covering
Rollover: 17% Previous 16%
BANKNIFTY JULY Future closed at: 57837.6 (0.520%)
July Fut Premium 79.75 (Increased by 3.85 points)
July Fut Open Interest Change: -2.7%
July Fut Volume Change: -2.3%
July Fut Open Interest Analysis: Short Covering
BANKNIFTY AUGUST Future closed at: 58132.8 (0.483%)
Aug Fut Premium 374.95 (Decreased by -15.95 points)
Aug Fut Open Interest Change: 0.43%
Aug Fut Volume Change: 6.27%
Aug Fut Open Interest Analysis: Fresh Long
BANKNIFTY Monthly Expiry (28/07/2026) Option Analysis
Put-Call Ratio (Open Interest): 0.851 (Decreased from 0.852)
Put-Call Ratio (Volume): 0.917
Max Pain Level: 58000
Maximum CALL Open Interest: 59000
Maximum PUT Open Interest: 59000
Highest CALL Addition: 57000
Highest PUT Addition: 54500
MIDCPNIFTY Future Analysis
MIDCPNIFTY Spot closed at: 14771.45 (0.400%)
Combined = July + August + September
Combined Fut Open Interest Change: -1.38%
Combined Fut Volume Change: 18.69%
Combined Fut Open Interest Analysis: Short Covering
Rollover: 4% Previous 4%
MIDCPNIFTY JULY Future closed at: 14766.3 (0.364%)
July Fut Discount -5.15 (Decreased by -5.25 points)
July Fut Open Interest Change: -1.88%
July Fut Volume Change: 22.11%
July Fut Open Interest Analysis: Short Covering
MIDCPNIFTY AUGUST Future closed at: 14822.7 (0.473%)
Aug Fut Discount 51.25 (Increased by 11 points)
Aug Fut Open Interest Change: 12.36%
Aug Fut Volume Change: -0.56%
Aug Fut Open Interest Analysis: Fresh Long
MIDCPNIFTY Monthly Expiry (28/07/2026) Option Analysis
Put-Call Ratio (Open Interest): 1.024 (Increased from 0.954)
Put-Call Ratio (Volume): 1.004
Max Pain Level: 14700
Maximum CALL Open Interest: 15000
Maximum PUT Open Interest: 14000
Highest CALL Addition: 15100
Highest PUT Addition: 14600
SENSEX Monthly Expiry (30/07/2026) Future
SENSEX Spot closed at: 77,185.43 (0.169%)
SENSEX Monthly Future closed at: 77,264.10 (0.162%)
Premium: 78.67 (Decreased by -5.69 points)
Open Interest Change: -1.14%
Volume Change: 84.19%
Open Interest Analysis: Short Covering
SENSEX Weekly Expiry (16/07/2026) Option Analysis
Put-Call Ratio (OI): 0.738 (Decreased from 0.847)
Put-Call Ratio (Volume): 1.089
Max Pain Level: 77200
Maximum CALL OI: 78000
Maximum PUT OI: 76000
Highest CALL Addition: 77600
Highest PUT Addition: 76000
FII & DII Cash Market Activity
FIIs Net SELL: ₹ 735.83 Cr.
DIIs Net BUY: ₹ 704.93 Cr.
FII Derivatives Activity
| FII Trading Stats | 15.07.26 | 14.07.26 | 13.07.26 |
| FII Cash (Provisional Data) | -735.83 | -739.69 | -3,062.27 |
| Index Future Open Interest Long Ratio | 8.36% | 8.37% | 10.03% |
| Index Future Volume Long Ratio | 56.41% | 29.88% | 49.13% |
| Call Option Open Interest Long Ratio | 39.93% | 41.31% | 42.61% |
| Call Option Volume Long Ratio | 49.32% | 49.02% | 50.22% |
| Put Option Open Interest Long Ratio | 69.45% | 71.99% | 63.39% |
| Put Option Volume Long Ratio | 50.03% | 50.02% | 49.88% |
| Stock Future Open Interest Long Ratio | 53.68% | 53.89% | 54.46% |
| Stock Future Volume Long Ratio | 47.59% | 44.03% | 49.09% |
| Index Futures | Short Covering | Long Covering | Long Covering |
| Index Options | Fresh Short | Long Covering | Short Covering |
| Nifty Futures | Short Covering | Fresh Short | Short Covering |
| Nifty Options | Fresh Short | Long Covering | Short Covering |
| BankNifty Futures | Short Covering | Long Covering | Long Covering |
| BankNifty Options | Short Covering | Fresh Short | Short Covering |
| FinNifty Futures | Short Covering | Fresh Short | Short Covering |
| FinNifty Options | Fresh Long | Fresh Short | Fresh Long |
| MidcpNifty Futures | Fresh Short | Fresh Short | Fresh Long |
| MidcpNifty Options | Fresh Long | Fresh Long | Fresh Short |
| NiftyNxt50 Futures | Fresh Long | Short Covering | Long Covering |
| NiftyNxt50 Options | Fresh Short | Fresh Short | Fresh Short |
| Stock Futures | Fresh Short | Long Covering | Fresh Short |
| Stock Options | Fresh Short | Fresh Short | Fresh Short |
NSE & BSE Option market Trends : Options Insights
SENSEX weekly Expiry (16/07/2026)
The SENSEX index closed at 77185.43. The SENSEX weekly expiry for JULY 16, 2026 has revealed key trends in open interest. The current Put/Call Ratio is at 0.738 against previous 0.847. The 78000CE option holds the maximum open interest, followed by the 77500CE and 79000CE options. Market participants have shown increased interest with significant open interest additions in the 77600CE option, with open interest additions also seen in the 77500CE and 78000CE options. On the other hand, open interest reductions were prominent in the 72500PE, 74000PE, and 73000PE options. Trading volume was highest in the 77000PE option, followed by the 77500CE and 78000CE options, indicating active trading in these strikes.
| SENSEX | Weekly | Expiry: | 16-07-2026 |
| Index Spot | PCR OI | Prev PCR OI | PCR VOL |
| 77185.43 | 0.738 | 0.847 | 1.089 |
| Total Open Interest Change in all CALLs & PUTs: | |||
| Current | Prior | Net Ch | |
| CALL: | 3,92,53,260 | 2,51,40,900 | 1,41,12,360 |
| PUT: | 2,89,80,380 | 2,12,84,320 | 76,96,060 |
| Top CALL Open Interest: | |||
| Strike | OI | OI Change | Volume |
| 78000 | 25,85,280 | 11,55,180 | 12,05,99,540 |
| 77500 | 24,28,720 | 12,48,220 | 13,56,48,200 |
| Top CALL Open Interest addition: | |||
| Strike | OI | OI Change | Volume |
| 77600 | 20,46,060 | 14,98,720 | 10,49,18,480 |
| 77500 | 24,28,720 | 12,48,220 | 13,56,48,200 |
| Top CALL Open Interest reduction: | |||
| Strike | OI | OI Change | Volume |
| 81000 | 9,24,820 | -1,74,360 | 69,76,960 |
| 77000 | 8,33,400 | -1,44,760 | 3,87,96,060 |
| Top CALL Volume: | |||
| Strike | OI | OI Change | Volume |
| 77500 | 24,28,720 | 12,48,220 | 13,56,48,200 |
| 78000 | 25,85,280 | 11,55,180 | 12,05,99,540 |
| Top PUT Open Interest: | |||
| Strike | OI | OI Change | Volume |
| 76000 | 19,95,260 | 9,53,120 | 7,22,64,280 |
| 76500 | 15,89,300 | 8,82,340 | 9,29,78,580 |
| Top PUT Open Interest addition: | |||
| Strike | OI | OI Change | Volume |
| 76000 | 19,95,260 | 9,53,120 | 7,22,64,280 |
| 76500 | 15,89,300 | 8,82,340 | 9,29,78,580 |
| Top PUT Open Interest reduction: | |||
| Strike | OI | OI Change | Volume |
| 72500 | 1,81,820 | -3,40,280 | 44,48,520 |
| 74000 | 12,58,760 | -3,31,800 | 2,06,58,620 |
| Top PUT Volume: | |||
| Strike | OI | OI Change | Volume |
| 77000 | 15,71,880 | 6,54,020 | 13,57,02,380 |
| 76500 | 15,89,300 | 8,82,340 | 9,29,78,580 |
NIFTY Weekly Expiry (21/07/2026)
The NIFTY index closed at 24078.5. The NIFTY weekly expiry for JULY 21, 2026 has revealed key trends in open interest. The current Put/Call Ratio is at 0.776 against previous 0.859. The 24200CE option holds the maximum open interest, followed by the 25000CE and 24500CE options. Market participants have shown increased interest with significant open interest additions in the 24200CE option, with open interest additions also seen in the 24150CE and 24500CE options. On the other hand, open interest reductions were prominent in the 22700PE, 22800PE, and 21700PE options. Trading volume was highest in the 24200CE option, followed by the 24200PE and 24100CE options, indicating active trading in these strikes.
| NIFTY | Weekly | Expiry: | 21-07-2026 |
| Index Spot | PCR OI | Prev PCR OI | PCR VOL |
| 24,078.50 | 0.776 | 0.859 | 0.994 |
| Total Open Interest Change in all CALLs & PUTs: | |||
| Current | Prior | Net Ch | |
| CALL: | 11,86,94,875 | 7,94,73,550 | 3,92,21,325 |
| PUT: | 9,21,02,790 | 6,82,38,300 | 2,38,64,490 |
| Top CALL Open Interest: | |||
| Strike | OI | OI Change | Volume |
| 24,200 | 89,78,710 | 46,96,315 | 30,14,703 |
| 25,000 | 73,60,860 | 13,86,905 | 6,36,168 |
| Top CALL Open Interest addition: | |||
| Strike | OI | OI Change | Volume |
| 24,200 | 89,78,710 | 46,96,315 | 30,14,703 |
| 24,150 | 41,22,690 | 26,46,410 | 13,99,638 |
| Top CALL Open Interest reduction: | |||
| Strike | OI | OI Change | Volume |
| 23,300 | 20,410 | -7,085 | 285 |
| 23,750 | 34,125 | -3,120 | 6,826 |
| Top CALL Volume: | |||
| Strike | OI | OI Change | Volume |
| 24,200 | 89,78,710 | 46,96,315 | 30,14,703 |
| 24,100 | 68,18,565 | 7,92,805 | 20,94,905 |
| Top PUT Open Interest: | |||
| Strike | OI | OI Change | Volume |
| 23,000 | 70,36,120 | 21,56,830 | 6,03,277 |
| 24,000 | 59,36,190 | 11,77,670 | 20,35,216 |
| Top PUT Open Interest addition: | |||
| Strike | OI | OI Change | Volume |
| 23,000 | 70,36,120 | 21,56,830 | 6,03,277 |
| 23,300 | 58,07,880 | 17,23,670 | 5,07,772 |
| Top PUT Open Interest reduction: | |||
| Strike | OI | OI Change | Volume |
| 22,700 | 9,94,630 | -2,35,040 | 1,71,884 |
| 22,800 | 15,92,760 | -2,04,945 | 1,97,907 |
| Top PUT Volume: | |||
| Strike | OI | OI Change | Volume |
| 24,200 | 29,50,610 | 11,42,960 | 21,27,029 |
| 24,000 | 59,36,190 | 11,77,670 | 20,35,216 |
NIFTY Monthly Expiry (28/07/2026)
The NIFTY index closed at 24078.5. The NIFTY monthly expiry for JULY 28, 2026 has revealed key trends in open interest. The current Put/Call Ratio is at 1.080 against previous 1.062. The 25000CE option holds the maximum open interest, followed by the 24000PE and 24000CE options. Market participants have shown increased interest with significant open interest additions in the 24200CE option, with open interest additions also seen in the 24100PE and 24100CE options. On the other hand, open interest reductions were prominent in the 24000PE, 26000PE, and 24000CE options. Trading volume was highest in the 24000PE option, followed by the 24500CE and 25000CE options, indicating active trading in these strikes.
| NIFTY | Monthly | Expiry: | 28-07-2026 |
| Index Spot | PCR OI | Prev PCR OI | PCR VOL |
| 24,078.50 | 1.080 | 1.062 | 0.954 |
| Total Open Interest Change in all CALLs & PUTs: | |||
| Current | Prior | Net Ch | |
| CALL: | 5,23,73,685 | 5,00,35,115 | 23,38,570 |
| PUT: | 5,65,47,790 | 5,31,22,615 | 34,25,175 |
| Top CALL Open Interest: | |||
| Strike | OI | OI Change | Volume |
| 25,000 | 69,91,595 | 1,85,770 | 1,15,187 |
| 24,000 | 53,51,385 | -90,415 | 95,457 |
| Top CALL Open Interest addition: | |||
| Strike | OI | OI Change | Volume |
| 24,200 | 33,35,280 | 4,82,950 | 1,06,991 |
| 24,100 | 23,97,395 | 2,94,125 | 90,161 |
| Top CALL Open Interest reduction: | |||
| Strike | OI | OI Change | Volume |
| 24,000 | 53,51,385 | -90,415 | 95,457 |
| 25,200 | 10,80,365 | -55,510 | 25,835 |
| Top CALL Volume: | |||
| Strike | OI | OI Change | Volume |
| 24,500 | 48,78,770 | -45,955 | 1,24,775 |
| 25,000 | 69,91,595 | 1,85,770 | 1,15,187 |
| Top PUT Open Interest: | |||
| Strike | OI | OI Change | Volume |
| 24,000 | 62,23,815 | -1,73,225 | 1,53,243 |
| 23,000 | 41,48,040 | 2,75,405 | 65,345 |
| Top PUT Open Interest addition: | |||
| Strike | OI | OI Change | Volume |
| 24,100 | 27,29,805 | 2,95,815 | 85,628 |
| 24,200 | 28,21,195 | 2,90,550 | 90,315 |
| Top PUT Open Interest reduction: | |||
| Strike | OI | OI Change | Volume |
| 24,000 | 62,23,815 | -1,73,225 | 1,53,243 |
| 26,000 | 23,04,770 | -1,04,780 | 2,409 |
| Top PUT Volume: | |||
| Strike | OI | OI Change | Volume |
| 24,000 | 62,23,815 | -1,73,225 | 1,53,243 |
| 24,200 | 28,21,195 | 2,90,550 | 90,315 |
BANKNIFTY Monthly Expiry (28/07/2026)
The BANKNIFTY index closed at 57757.85. The BANKNIFTY monthly expiry for JULY 28, 2026 has revealed key trends in open interest. The current Put/Call Ratio is at 0.851 against previous 0.852. The 59000CE option holds the maximum open interest, followed by the 60000CE and 58000CE options. Market participants have shown increased interest with significant open interest additions in the 54500PE option, with open interest additions also seen in the 57000CE and 59500CE options. On the other hand, open interest reductions were prominent in the 57500CE, 61000CE, and 58000CE options. Trading volume was highest in the 58000CE option, followed by the 58000PE and 59000CE options, indicating active trading in these strikes.
| BANKNIFTY | Monthly | Expiry: | 28-07-2026 |
| Index Spot | PCR OI | Prev PCR OI | PCR VOL |
| 57,757.85 | 0.851 | 0.852 | 0.917 |
| Total Open Interest Change in all CALLs & PUTs: | |||
| Current | Prior | Net Ch | |
| CALL: | 1,53,18,840 | 1,52,92,380 | 26,460 |
| PUT: | 1,30,42,920 | 1,30,24,860 | 18,060 |
| Top CALL Open Interest: | |||
| Strike | OI | OI Change | Volume |
| 59,000 | 22,30,080 | 27,990 | 93,398 |
| 60,000 | 16,19,610 | -27,360 | 89,841 |
| Top CALL Open Interest addition: | |||
| Strike | OI | OI Change | Volume |
| 57,000 | 4,91,370 | 1,13,760 | 33,738 |
| 59,500 | 4,86,510 | 55,380 | 44,390 |
| Top CALL Open Interest reduction: | |||
| Strike | OI | OI Change | Volume |
| 57,500 | 4,16,670 | -1,39,260 | 59,397 |
| 61,000 | 6,16,860 | -60,630 | 42,462 |
| Top CALL Volume: | |||
| Strike | OI | OI Change | Volume |
| 58,000 | 13,72,890 | -54,480 | 2,07,148 |
| 59,000 | 22,30,080 | 27,990 | 93,398 |
| Top PUT Open Interest: | |||
| Strike | OI | OI Change | Volume |
| 59,000 | 12,07,560 | -52,500 | 13,805 |
| 58,000 | 10,18,200 | 27,120 | 1,58,405 |
| Top PUT Open Interest addition: | |||
| Strike | OI | OI Change | Volume |
| 54,500 | 3,39,120 | 1,14,480 | 27,883 |
| 57,900 | 1,40,400 | 46,440 | 47,911 |
| Top PUT Open Interest reduction: | |||
| Strike | OI | OI Change | Volume |
| 59,000 | 12,07,560 | -52,500 | 13,805 |
| 58,800 | 61,140 | -51,180 | 10,400 |
| Top PUT Volume: | |||
| Strike | OI | OI Change | Volume |
| 58,000 | 10,18,200 | 27,120 | 1,58,405 |
| 57,500 | 5,03,550 | -10,890 | 89,724 |
MIDCPNIFTY Monthly Expiry (28/07/2026)
The MIDCPNIFTY index closed at 14771.45. The MIDCPNIFTY monthly expiry for JULY 28, 2026, 2025 has revealed key trends in open interest. The current Put/Call Ratio is at 1.024 against previous 0.954. The 15000CE option holds the maximum open interest, followed by the 14000PE and 13500PE options. Market participants have shown increased interest with significant open interest additions in the 14600PE option, with open interest additions also seen in the 13000PE and 14800PE options. On the other hand, open interest reductions were prominent in the 77100CE, 72600CE, and 77000PE options. Trading volume was highest in the 15000CE option, followed by the 14800PE and 14800CE options, indicating active trading in these strikes.
| MIDCPNIFTY | Monthly | Expiry: | 28-07-2026 |
| Index Spot | PCR OI | Prev PCR OI | PCR VOL |
| 14,771.45 | 1.024 | 0.954 | 1.004 |
| Total Open Interest Change in all CALLs & PUTs: | |||
| Current | Prior | Net Ch | |
| CALL: | 57,62,400 | 56,81,640 | 80,760 |
| PUT: | 59,01,600 | 54,20,400 | 4,81,200 |
| Top CALL Open Interest: | |||
| Strike | OI | OI Change | Volume |
| 15,000 | 7,62,600 | -98,760 | 14,751 |
| 15,500 | 5,16,960 | 13,320 | 2,221 |
| Top CALL Open Interest addition: | |||
| Strike | OI | OI Change | Volume |
| 15,100 | 1,95,960 | 73,440 | 3,760 |
| 14,600 | 2,51,880 | 61,440 | 1,654 |
| Top CALL Open Interest reduction: | |||
| Strike | OI | OI Change | Volume |
| 15,000 | 7,62,600 | -98,760 | 14,751 |
| 14,700 | 3,08,160 | -73,440 | 4,948 |
| Top CALL Volume: | |||
| Strike | OI | OI Change | Volume |
| 15,000 | 7,62,600 | -98,760 | 14,751 |
| 14,800 | 4,38,000 | 47,400 | 13,917 |
| Top PUT Open Interest: | |||
| Strike | OI | OI Change | Volume |
| 14,000 | 6,29,880 | -9,720 | 4,908 |
| 13,500 | 5,50,440 | -29,400 | 2,579 |
| Top PUT Open Interest addition: | |||
| Strike | OI | OI Change | Volume |
| 14,600 | 3,59,640 | 1,02,480 | 5,075 |
| 13,000 | 3,66,360 | 1,01,640 | 2,312 |
| Top PUT Open Interest reduction: | |||
| Strike | OI | OI Change | Volume |
| 14,500 | 4,25,880 | -43,320 | 6,110 |
| 13,500 | 5,50,440 | -29,400 | 2,579 |
| Top PUT Volume: | |||
| Strike | OI | OI Change | Volume |
| 14,800 | 3,78,600 | 1,00,080 | 14,315 |
| 14,700 | 3,26,400 | 72,000 | 6,585 |
Conclusion: What the NSE & BSE Indices Futures and Options Open Interest Volume Analysis Tells Us
To wrap this up, our Open Interest Volume Analysis paints a picture of a market that has a solid bullish undercurrent but is trapped in a tight near-term range. The relentless unwinding of shorts combined with the forward rollover of long positions gives us a clear edge, provided we respect the option writers’ boundaries. Here is your actionable feedback and trading game plan for the coming sessions:
Nifty 50 Strategy: The market is pinned at the 24100 Max Pain level for this week. With the highest Call addition capping the upside at 24200 and massive Put OI support way down at 23000, do not chase gap-ups. Treat this as a “buy the dip” market and look for long entries closer to the 24000 psychological support.
BankNifty’s Big Squeeze: BankNifty is showing strong relative performance (up over 0.5%), but it’s heading straight into a massive wall. With both maximum Call and Put OI piled up evenly at the 59000 strike for the monthly expiry, a brutal tug-of-war is inevitable. Keep your sizing small and use 57000 as a strict trailing stop-loss for any long trades.
Midcap Nifty Momentum: This is where the aggressive money is hiding right now. The 12%+ jump in fresh August longs is a massive tell. Use any intraday dips towards the 14700 Max Pain base as an accumulation zone.
Sensex Expiry Action: For the immediate weekly expiry, the 77200 Max Pain level is acting as a literal magnet. With the PCR depressed at 0.738 and a heavy ceiling of Call writers at 78000, directional plays are risky. Consider non-directional theta-decay strategies (like short straddles or iron condors) anchored around the 77200 zone.
Check Previous Day’s NSE & BSE Indices F&O Analysis
FII / FPI trading activity in Capital Market Segment
NSE Derivatives Raw Data
BSE Derivatives Raw Data
Disclaimer
fnodata.com is a financial blog providing research-based data and analysis. The content creator of the fnodata.com is not a SEBI registered Investment Advisor. The content on this blog is for informational purposes only and should not be considered as investment advice. You are responsible for your own investment decisions. You should consult with a financial advisor or conduct your own research before making any investment decisions.