Turning Complex Derivative Data into Clear Market Insights

NSE & BSE Indices Futures and Options Open Interest Volume Analysis for 21/07/2026

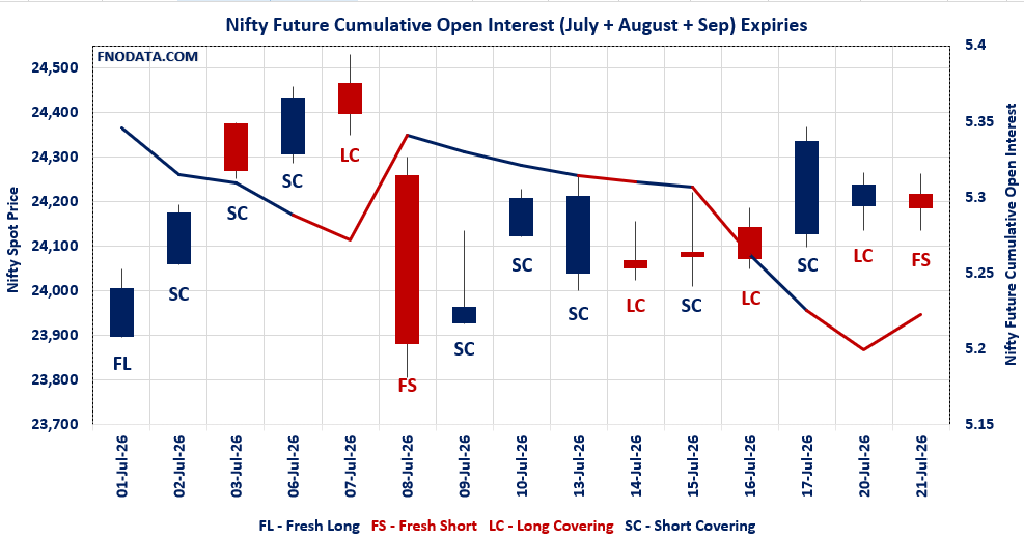
Table of Contents
Hey traders! Welcome back to our daily market breakdown for July 21, 2026. If you’ve been watching the screens today, you’ve probably noticed a distinct chill in the air—and our deep Open Interest Volume Analysis confirms that a bearish wave is firmly sweeping across the major indices. By diving into the futures positioning, option chain metrics, and rollovers, we can clearly track where the smart money is heavily leaning. Let’s get right into the data and break down exactly what the market is telling us:
NIFTY’s Bearish Grip: Spot closed in the red at 24,187.7 (-0.21%), backed by a textbook “Fresh Short” build-up. Our Open Interest Volume Analysis shows combined OI ticking up by 2.36% while volumes dropped 10.52%, meaning sellers are confidently holding their ground. Add in the Put-Call Ratio (PCR) sliding from 1.085 to a bearish 0.912 and massive straddle writing at the 24,200 strike (which is also the Max Pain level), and it’s clear the upside is tightly capped.
BANKNIFTY’s Weakness: The banking index mirrored this weakness, shedding 0.189% to close at 57,835.35. We’re seeing fresh shorting across July and August futures, with combined OI rising 4.27% alongside a stark volume drop (-58.56%). The PCR plunging to 0.882 and intense Call writing at 58,000 (Highest Call Addition & Max Pain) screams that bears are fully in the driver’s seat.
MIDCPNIFTY’s Deceptive Green: Midcaps offered a slight green close at 14,814.3 (+0.234%), driven by minor short covering in July. However, don’t let that fool you—looking ahead, the August futures recorded an eye-watering 1247.14% spike in OI with a 303.92% volume surge, signaling aggressive fresh shorting. PCR cooled from 1.069 to 1.023, maintaining a cautious undertone against the Max Pain of 14,700.
SENSEX Under Pressure: Closing down 0.307% at 77,470.11, Sensex futures are also seeing undeniable fresh short build-ups (OI up 7.77%). The most glaring red flag? The weekly options PCR plummeted from 1.204 to a highly bearish 0.829, with heavy Call and Put additions anchoring right at the 77,500 Max Pain level.
NSE & BSE F&O Market Signals
NIFTY Future analysis
NIFTY Spot closed at: 24187.7 (-0.210%)
Combined = July + August + September
Combined Fut Open Interest Change: 2.36%
Combined Fut Volume Change: -10.52%
Combined Fut Open Interest Analysis: Fresh Short
Rollover: 16% Previous 16%
NIFTY JULY Future closed at: 24180.6 (-0.325%)
July Fut Discount -7.1 (Decreased by -28.1 points)
July Fut Open Interest Change: 1.61%
July Fut Volume Change: -5.72%
July Fut Open Interest Analysis: Fresh Short
NIFTY AUGUST Future closed at: 24275.2 (-0.317%)
Aug Fut Discount 87.5 (Decreased by -26.5 points)
Aug Fut Open Interest Change: 6.79%
Aug Fut Volume Change: -28.78%
Aug Fut Open Interest Analysis: Fresh Short
NIFTY Monthly Expiry (28/07/2026) Option Analysis
Put-Call Ratio (Open Interest): 0.912 (Decreased from 1.085)
Put-Call Ratio (Volume): 0.876
Max Pain Level: 24200
Maximum CALL Open Interest: 24200
Maximum PUT Open Interest: 24200
Highest CALL Addition: 24200
Highest PUT Addition: 24200
BANKNIFTY Future Analysis
BANKNIFTY Spot closed at: 57835.35 (-0.189%)
Combined = July + August + September
Combined Fut Open Interest Change: 4.27%
Combined Fut Volume Change: -58.56%
Combined Fut Open Interest Analysis: Fresh Short
Rollover: 23% Previous 21%
BANKNIFTY JULY Future closed at: 57968.6 (-0.269%)
July Fut Premium 133.25 (Decreased by -46.75 points)
July Fut Open Interest Change: 2.7%
July Fut Volume Change: -59.8%
July Fut Open Interest Analysis: Fresh Short
BANKNIFTY AUGUST Future closed at: 58239.2 (-0.240%)
Aug Fut Premium 403.85 (Decreased by -30.75 points)
Aug Fut Open Interest Change: 9.73%
Aug Fut Volume Change: -55.88%
Aug Fut Open Interest Analysis: Fresh Short
BANKNIFTY Monthly Expiry (28/07/2026) Option Analysis
Put-Call Ratio (Open Interest): 0.882 (Decreased from 0.933)
Put-Call Ratio (Volume): 0.985
Max Pain Level: 58000
Maximum CALL Open Interest: 59000
Maximum PUT Open Interest: 58000
Highest CALL Addition: 58000
Highest PUT Addition: 56500
MIDCPNIFTY Future Analysis
MIDCPNIFTY Spot closed at: 14814.3 (0.234%)
Combined = July + August + September
Combined Fut Open Interest Change: -0.10%
Combined Fut Volume Change: -67.08%
Combined Fut Open Interest Analysis: Short Covering
Rollover: 6% Previous 5%
MIDCPNIFTY JULY Future closed at: 14835.45 (0.090%)
July Fut Premium 21.15 (Decreased by -21.3 points)
July Fut Open Interest Change: -0.34%
July Fut Volume Change: -71.80%
July Fut Open Interest Analysis: Short Covering
MIDCPNIFTY AUGUST Future closed at: 14869.7 (-0.197%)
Aug Fut Premium 55.4 (Decreased by -63.95 points)
Aug Fut Open Interest Change: 1247.14%
Aug Fut Volume Change: 303.92%
Aug Fut Open Interest Analysis: Fresh Short
MIDCPNIFTY Monthly Expiry (28/07/2026) Option Analysis
Put-Call Ratio (Open Interest): 1.023 (Decreased from 1.069)
Put-Call Ratio (Volume): 0.942
Max Pain Level: 14700
Maximum CALL Open Interest: 15500
Maximum PUT Open Interest: 14000
Highest CALL Addition: 15500
Highest PUT Addition: 14000
SENSEX Monthly Expiry (30/07/2026) Future
SENSEX Spot closed at: 77,470.11 (-0.307%)
SENSEX Monthly Future closed at: 77,533.05 (-0.335%)
Premium: 62.94 (Decreased by -22.44 points)
Open Interest Change: 7.77%
Volume Change: -48.82%
Open Interest Analysis: Fresh Short
SENSEX Weekly Expiry (23/07/2026) Option Analysis
Put-Call Ratio (OI): 0.829 (Decreased from 1.204)
Put-Call Ratio (Volume): 1.050
Max Pain Level: 77500
Maximum CALL OI: 77500
Maximum PUT OI: 77500
Highest CALL Addition: 77500
Highest PUT Addition: 76000
FII & DII Cash Market Activity
FIIs Net BUY: ₹ 1,650.16 Cr.
DIIs Net SELL: ₹ 656.88 Cr.
FII Derivatives Activity
| FII Trading Stats | 21.07.26 | 20.07.26 | 17.07.26 |
| FII Cash (Provisional Data) | 1,650.16 | -1,121.04 | -376.41 |
| Index Future Open Interest Long Ratio | 8.58% | 9.37% | 11.01% |
| Index Future Volume Long Ratio | 25.35% | 44.96% | 78.12% |
| Call Option Open Interest Long Ratio | 42.37% | 43.89% | 47.20% |
| Call Option Volume Long Ratio | 49.00% | 49.49% | 51.18% |
| Put Option Open Interest Long Ratio | 70.61% | 62.31% | 61.71% |
| Put Option Volume Long Ratio | 49.38% | 50.08% | 49.31% |
| Stock Future Open Interest Long Ratio | 53.74% | 53.97% | 53.95% |
| Stock Future Volume Long Ratio | 47.95% | 50.01% | 51.30% |
| Index Futures | Fresh Short | Long Covering | Short Covering |
| Index Options | Long Covering | Long Covering | Fresh Long |
| Nifty Futures | Fresh Short | Short Covering | Short Covering |
| Nifty Options | Long Covering | Long Covering | Fresh Long |
| BankNifty Futures | Fresh Short | Long Covering | Fresh Long |
| BankNifty Options | Fresh Short | Fresh Short | Long Covering |
| FinNifty Futures | Short Covering | Short Covering | Fresh Long |
| FinNifty Options | Long Covering | Fresh Long | Fresh Long |
| MidcpNifty Futures | Fresh Short | Fresh Short | Long Covering |
| MidcpNifty Options | Fresh Short | Long Covering | Long Covering |
| NiftyNxt50 Futures | Fresh Short | Fresh Short | Short Covering |
| NiftyNxt50 Options | Fresh Short | Fresh Long | Long Covering |
| Stock Futures | Fresh Short | Short Covering | Short Covering |
| Stock Options | Fresh Short | Fresh Long | Fresh Long |
NSE & BSE Option market Trends : Options Insights
SENSEX weekly Expiry (23/07/2026)
The SENSEX index closed at 77470.11. The SENSEX weekly expiry for JULY 23, 2026 has revealed key trends in open interest. The current Put/Call Ratio is at 0.829 against previous 1.204. The 77500CE option holds the maximum open interest, followed by the 78000CE and 80000CE options. Market participants have shown increased interest with significant open interest additions in the 77500CE option, with open interest additions also seen in the 79000CE and 78500CE options. On the other hand, open interest reductions were prominent in the 77700PE, 77800PE, and 70000PE options. Trading volume was highest in the 77500PE option, followed by the 77500CE and 77400PE options, indicating active trading in these strikes.
| SENSEX | Weekly | Expiry: | 23-07-2026 |
| Index Spot | PCR OI | Prev PCR OI | PCR VOL |
| 77470.11 | 0.829 | 1.204 | 1.050 |
| Total Open Interest Change in all CALLs & PUTs: | |||
| Current | Prior | Net Ch | |
| CALL: | 2,46,35,780 | 1,20,31,600 | 1,26,04,180 |
| PUT: | 2,04,24,400 | 1,44,86,380 | 59,38,020 |
| Top CALL Open Interest: | |||
| Strike | OI | OI Change | Volume |
| 77500 | 18,59,700 | 12,58,300 | 2,54,59,360 |
| 78000 | 13,74,720 | 7,60,460 | 1,48,74,280 |
| Top CALL Open Interest addition: | |||
| Strike | OI | OI Change | Volume |
| 77500 | 18,59,700 | 12,58,300 | 2,54,59,360 |
| 79000 | 13,45,520 | 8,72,180 | 92,17,060 |
| Top CALL Open Interest reduction: | |||
| Strike | OI | OI Change | Volume |
| 81800 | 12,780 | -10,080 | 1,52,300 |
| 83200 | 17,460 | -8,240 | 64,840 |
| Top CALL Volume: | |||
| Strike | OI | OI Change | Volume |
| 77500 | 18,59,700 | 12,58,300 | 2,54,59,360 |
| 77700 | 12,64,820 | 8,27,440 | 1,64,98,320 |
| Top PUT Open Interest: | |||
| Strike | OI | OI Change | Volume |
| 77500 | 12,66,380 | 2,95,200 | 2,74,22,920 |
| 76000 | 11,75,500 | 5,11,980 | 94,39,840 |
| Top PUT Open Interest addition: | |||
| Strike | OI | OI Change | Volume |
| 76000 | 11,75,500 | 5,11,980 | 94,39,840 |
| 75500 | 11,44,940 | 4,85,100 | 69,49,880 |
| Top PUT Open Interest reduction: | |||
| Strike | OI | OI Change | Volume |
| 77700 | 2,90,280 | -3,65,960 | 1,29,00,800 |
| 77800 | 2,28,000 | -1,66,600 | 59,81,160 |
| Top PUT Volume: | |||
| Strike | OI | OI Change | Volume |
| 77500 | 12,66,380 | 2,95,200 | 2,74,22,920 |
| 77400 | 8,52,200 | 4,48,100 | 1,99,52,580 |
NIFTY Monthly Expiry (28/07/2026)
The NIFTY index closed at 24187.7. The NIFTY monthly expiry for JULY 28, 2026 has revealed key trends in open interest. The current Put/Call Ratio is at 0.912 against previous 1.085. The 24200CE option holds the maximum open interest, followed by the 25500CE and 25000CE options. Market participants have shown increased interest with significant open interest additions in the 24200CE option, with open interest additions also seen in the 25500CE and 24200PE options. On the other hand, open interest reductions were prominent in the 26050CE, 23350PE, and 26000PE options. Trading volume was highest in the 24200CE option, followed by the 24200PE and 24000PE options, indicating active trading in these strikes.
| NIFTY | Monthly | Expiry: | 28-07-2026 |
| Index Spot | PCR OI | Prev PCR OI | PCR VOL |
| 24,187.70 | 0.912 | 1.085 | 0.876 |
| Total Open Interest Change in all CALLs & PUTs: | |||
| Current | Prior | Net Ch | |
| CALL: | 12,25,90,325 | 7,36,10,355 | 4,89,79,970 |
| PUT: | 11,18,56,940 | 7,98,80,450 | 3,19,76,490 |
| Top CALL Open Interest: | |||
| Strike | OI | OI Change | Volume |
| 24,200 | 1,12,91,410 | 68,95,525 | 6,15,450 |
| 25,500 | 1,01,66,975 | 63,05,910 | 2,68,500 |
| Top CALL Open Interest addition: | |||
| Strike | OI | OI Change | Volume |
| 24,200 | 1,12,91,410 | 68,95,525 | 6,15,450 |
| 25,500 | 1,01,66,975 | 63,05,910 | 2,68,500 |
| Top CALL Open Interest reduction: | |||
| Strike | OI | OI Change | Volume |
| 26,050 | 1,15,245 | -51,805 | 6,661 |
| 22,500 | 2,67,735 | -23,790 | 874 |
| Top CALL Volume: | |||
| Strike | OI | OI Change | Volume |
| 24,200 | 1,12,91,410 | 68,95,525 | 6,15,450 |
| 24,500 | 79,33,445 | 22,51,405 | 3,70,996 |
| Top PUT Open Interest: | |||
| Strike | OI | OI Change | Volume |
| 24,200 | 93,99,455 | 49,75,425 | 5,51,230 |
| 23,000 | 92,24,800 | 32,26,990 | 2,12,711 |
| Top PUT Open Interest addition: | |||
| Strike | OI | OI Change | Volume |
| 24,200 | 93,99,455 | 49,75,425 | 5,51,230 |
| 23,000 | 92,24,800 | 32,26,990 | 2,12,711 |
| Top PUT Open Interest reduction: | |||
| Strike | OI | OI Change | Volume |
| 23,350 | 5,39,370 | -44,070 | 25,716 |
| 26,000 | 20,74,215 | -43,355 | 1,925 |
| Top PUT Volume: | |||
| Strike | OI | OI Change | Volume |
| 24,200 | 93,99,455 | 49,75,425 | 5,51,230 |
| 24,000 | 76,13,190 | 8,66,645 | 3,84,153 |
BANKNIFTY Monthly Expiry (28/07/2026)
The BANKNIFTY index closed at 57835.35. The BANKNIFTY monthly expiry for JULY 28, 2026 has revealed key trends in open interest. The current Put/Call Ratio is at 0.882 against previous 0.933. The 59000CE option holds the maximum open interest, followed by the 60000CE and 58000CE options. Market participants have shown increased interest with significant open interest additions in the 58000CE option, with open interest additions also seen in the 56500PE and 56000PE options. On the other hand, open interest reductions were prominent in the 52500PE, 54000PE, and 52000PE options. Trading volume was highest in the 58000CE option, followed by the 58000PE and 59000CE options, indicating active trading in these strikes.
| BANKNIFTY | Monthly | Expiry: | 28-07-2026 |
| Index Spot | PCR OI | Prev PCR OI | PCR VOL |
| 57,835.35 | 0.882 | 0.933 | 0.985 |
| Total Open Interest Change in all CALLs & PUTs: | |||
| Current | Prior | Net Ch | |
| CALL: | 1,76,27,760 | 1,62,38,520 | 13,89,240 |
| PUT: | 1,55,50,920 | 1,51,56,210 | 3,94,710 |
| Top CALL Open Interest: | |||
| Strike | OI | OI Change | Volume |
| 59,000 | 21,48,330 | -29,850 | 1,06,931 |
| 60,000 | 19,74,840 | 15,420 | 85,122 |
| Top CALL Open Interest addition: | |||
| Strike | OI | OI Change | Volume |
| 58,000 | 18,94,830 | 4,87,950 | 2,37,119 |
| 58,500 | 12,01,140 | 1,70,370 | 85,729 |
| Top CALL Open Interest reduction: | |||
| Strike | OI | OI Change | Volume |
| 63,000 | 3,91,620 | -37,830 | 7,909 |
| 56,700 | 62,520 | -37,560 | 1,601 |
| Top CALL Volume: | |||
| Strike | OI | OI Change | Volume |
| 58,000 | 18,94,830 | 4,87,950 | 2,37,119 |
| 59,000 | 21,48,330 | -29,850 | 1,06,931 |
| Top PUT Open Interest: | |||
| Strike | OI | OI Change | Volume |
| 58,000 | 13,64,220 | 1,86,540 | 1,97,076 |
| 59,000 | 11,29,050 | -46,920 | 8,743 |
| Top PUT Open Interest addition: | |||
| Strike | OI | OI Change | Volume |
| 56,500 | 6,80,520 | 2,62,350 | 62,116 |
| 56,000 | 10,61,010 | 2,61,120 | 67,418 |
| Top PUT Open Interest reduction: | |||
| Strike | OI | OI Change | Volume |
| 52,500 | 1,71,750 | -64,590 | 7,023 |
| 54,000 | 4,92,570 | -62,400 | 26,844 |
| Top PUT Volume: | |||
| Strike | OI | OI Change | Volume |
| 58,000 | 13,64,220 | 1,86,540 | 1,97,076 |
| 57,900 | 2,42,760 | 30,600 | 1,03,126 |
MIDCPNIFTY Monthly Expiry (28/07/2026)
The MIDCPNIFTY index closed at 14814.3. The MIDCPNIFTY monthly expiry for JULY 28, 2026, 2025 has revealed key trends in open interest. The current Put/Call Ratio is at 1.023 against previous 1.069. The 14000PE option holds the maximum open interest, followed by the 15500CE and 15200CE options. Market participants have shown increased interest with significant open interest additions in the 15500CE option, with open interest additions also seen in the 15100CE and 14000PE options. On the other hand, open interest reductions were prominent in the 75000CE, 78100CE, and 78100PE options. Trading volume was highest in the 14800CE option, followed by the 14800PE and 14900CE options, indicating active trading in these strikes.
| MIDCPNIFTY | Monthly | Expiry: | 28-07-2026 |
| Index Spot | PCR OI | Prev PCR OI | PCR VOL |
| 14,814.30 | 1.023 | 1.069 | 0.942 |
| Total Open Interest Change in all CALLs & PUTs: | |||
| Current | Prior | Net Ch | |
| CALL: | 73,88,640 | 67,87,560 | 6,01,080 |
| PUT: | 75,60,120 | 72,53,520 | 3,06,600 |
| Top CALL Open Interest: | |||
| Strike | OI | OI Change | Volume |
| 15,500 | 8,29,440 | 2,24,280 | 4,787 |
| 15,200 | 7,79,760 | 1,07,760 | 6,036 |
| Top CALL Open Interest addition: | |||
| Strike | OI | OI Change | Volume |
| 15,500 | 8,29,440 | 2,24,280 | 4,787 |
| 15,100 | 5,09,160 | 1,97,880 | 7,318 |
| Top CALL Open Interest reduction: | |||
| Strike | OI | OI Change | Volume |
| 14,700 | 4,60,080 | -49,440 | 3,192 |
| 16,000 | 1,37,160 | -48,240 | 1,432 |
| Top CALL Volume: | |||
| Strike | OI | OI Change | Volume |
| 14,800 | 6,42,480 | 53,640 | 21,225 |
| 14,900 | 4,90,800 | 34,440 | 14,750 |
| Top PUT Open Interest: | |||
| Strike | OI | OI Change | Volume |
| 14,000 | 9,53,760 | 1,45,800 | 6,959 |
| 14,800 | 6,85,440 | 97,200 | 15,072 |
| Top PUT Open Interest addition: | |||
| Strike | OI | OI Change | Volume |
| 14,000 | 9,53,760 | 1,45,800 | 6,959 |
| 14,800 | 6,85,440 | 97,200 | 15,072 |
| Top PUT Open Interest reduction: | |||
| Strike | OI | OI Change | Volume |
| 14,500 | 5,52,240 | -1,02,000 | 9,977 |
| 13,900 | 1,17,840 | -65,040 | 1,813 |
| Top PUT Volume: | |||
| Strike | OI | OI Change | Volume |
| 14,800 | 6,85,440 | 97,200 | 15,072 |
| 14,500 | 5,52,240 | -1,02,000 | 9,977 |
Conclusion: What the NSE & BSE Indices Futures and Options Open Interest Volume Analysis Tells Us
To wrap things up, our comprehensive Open Interest Volume Analysis for July 21 paints a definitively bearish picture across the entire board. The consistent theme of “Fresh Short” formations in NIFTY, BANKNIFTY, and SENSEX futures—combined with shrinking premiums, noticeable rollover upticks, and declining Put-Call Ratios—shows that market participants are bracing for further downside or, at best, a rigid consolidation around current Max Pain levels.
Actionable Feedback for Traders: If you are currently holding long positions, it is time to strictly trail your stop-losses. The aggressive Call additions at 24,200 for NIFTY and 58,000 for BANKNIFTY suggest these will act as iron-clad resistance zones for the upcoming expiry.
Strategic Play: Avoid trying to catch falling knives. Instead, look for sell-on-rise opportunities near these major resistance zones. Alternatively, consider deploying non-directional, delta-neutral strategies like Iron Condors or Short Straddles (with strict hedges) right around the Max Pain levels (24,200 for Nifty, 58,000 for BankNifty).
Keep an Eye On: Watch out for the massive August short build-up we uncovered in the MIDCPNIFTY Open Interest Volume Analysis; any further spot break below 14,700 could trigger a sharp, momentum-driven sell-off. Stick to the data, respect the resistance levels, and trade smart!
Check Previous Day’s NSE & BSE Indices F&O Analysis
FII / FPI trading activity in Capital Market Segment
NSE Derivatives Raw Data
BSE Derivatives Raw Data
Disclaimer
fnodata.com is a financial blog providing research-based data and analysis. The content creator of the fnodata.com is not a SEBI registered Investment Advisor. The content on this blog is for informational purposes only and should not be considered as investment advice. You are responsible for your own investment decisions. You should consult with a financial advisor or conduct your own research before making any investment decisions.