Turning Complex Derivative Data into Clear Market Insights

NSE & BSE Indices Futures and Options Open Interest Volume Analysis for 30/07/2026

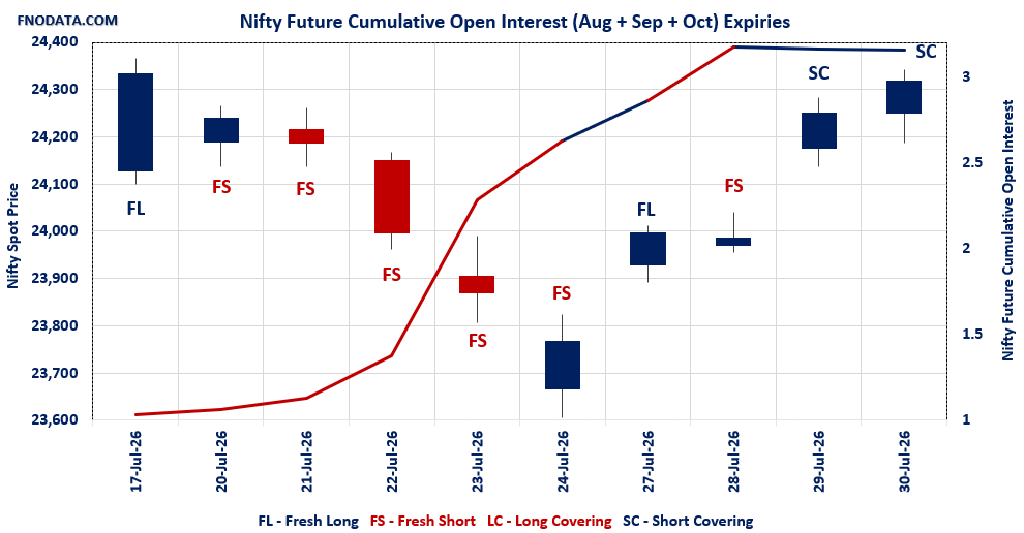
Table of Contents
Welcome back, traders! If you’re looking at today’s market data from July 30, 2026, you’ve probably noticed a massive tug-of-war happening across the benchmark indices. To make sense of this mixed momentum, we have to look under the hood and rely on solid Open Interest Volume Analysis. Relying on price action alone right now is a trap because the derivatives data is telling a tale of two completely different markets. Nifty and BankNifty are actively pulling in opposite directions, and jumping in without understanding the underlying positioning is a recipe for getting chopped up. Here is exactly what our deep dive into the data reveals:
Nifty & Sensex are holding the fort: We are seeing undeniable short covering in August Nifty futures (volumes dropped while premiums cooled), meaning bears are scrambling for the exits. Meanwhile, Sensex is aggressively building fresh longs with a massive 16.27% spike in OI.
BankNifty is the glaring weak link: In stark contrast, banking stocks are getting heavily pressured. We are tracking a clear fresh short buildup across both August and September expiries, backed by rising volumes and a declining premium.
Midcaps are quietly losing steam: The Midcap-Nifty data shows long covering (profit booking) for the current month and fresh shorts being initiated for September.
The Bottom Line: Our initial Open Interest Volume Analysis points to a classic, textbook market divergence. The bulls have control of the broader market, but financial heavyweights are dragging the chain.
NSE & BSE F&O Market Signals
NIFTY Future analysis
NIFTY Spot closed at: 24317.15 (0.276%)
Combined = August + September + October
Combined Fut Open Interest Change: -0.56%
Combined Fut Volume Change: -24.86%
Combined Fut Open Interest Analysis: Short Covering
Rollover: 8% Previous 7%
NIFTY AUGUST Future closed at: 24358 (0.191%)
Aug Fut Premium 40.85 (Decreased by -20.45 points)
Aug Fut Open Interest Change: -0.99%
Aug Fut Volume Change: -23.37%
Aug Fut Open Interest Analysis: Short Covering
NIFTY SEPTEMBER Future closed at: 24474.3 (0.177%)
Sep Fut Premium 157.15 (Decreased by -23.75 points)
Sep Fut Open Interest Change: 3.09%
Sep Fut Volume Change: -45.30%
Sep Fut Open Interest Analysis: Fresh Long
NIFTY Weekly Expiry (04/08/2026) Option Analysis
Put-Call Ratio (Open Interest): 1.294 (Increased from 1.167)
Put-Call Ratio (Volume): 0.873
Max Pain Level: 24250
Maximum CALL Open Interest: 24600
Maximum PUT Open Interest: 24000
Highest CALL Addition: 24500
Highest PUT Addition: 23400
NIFTY Monthly Expiry (25/08/2026) Option Analysis
Put-Call Ratio (Open Interest): 1.137 (Increased from 1.127)
Put-Call Ratio (Volume): 1.125
Max Pain Level: 24200
Maximum CALL Open Interest: 24000
Maximum PUT Open Interest: 24000
Highest CALL Addition: 25000
Highest PUT Addition: 24000
BANKNIFTY Future Analysis
BANKNIFTY Spot closed at: 57147.5 (-0.102%)
Combined = August + September + October
Combined Fut Open Interest Change: 2.18%
Combined Fut Volume Change: 7.43%
Combined Fut Open Interest Analysis: Fresh Short
Rollover: 7% Previous 7%
BANKNIFTY AUGUST Future closed at: 57294.6 (-0.087%)
Aug Fut Premium 147.1 (Increased by 8.6 points)
Aug Fut Open Interest Change: 2.0%
Aug Fut Volume Change: 6.8%
Aug Fut Open Interest Analysis: Fresh Short
BANKNIFTY SEPTEMBER Future closed at: 57653.8 (-0.111%)
Sep Fut Premium 506.3 (Decreased by -5.6 points)
Sep Fut Open Interest Change: 1.89%
Sep Fut Volume Change: 9.78%
Sep Fut Open Interest Analysis: Fresh Short
BANKNIFTY Monthly Expiry (25/08/2026) Option Analysis
Put-Call Ratio (Open Interest): 0.885 (Decreased from 0.897)
Put-Call Ratio (Volume): 0.889
Max Pain Level: 57500
Maximum CALL Open Interest: 58000
Maximum PUT Open Interest: 58000
Highest CALL Addition: 57000
Highest PUT Addition: 57000
MIDCPNIFTY Future Analysis
MIDCPNIFTY Spot closed at: 14676.65 (-0.044%)
Combined = August + September + October
Combined Fut Open Interest Change: -1.00%
Combined Fut Volume Change: -15.79%
Combined Fut Open Interest Analysis: Long Covering
Rollover: 2% Previous 2%
MIDCPNIFTY AUGUST Future closed at: 14705.2 (-0.167%)
Aug Fut Premium 28.55 (Decreased by -18.25 points)
Aug Fut Open Interest Change: -1.20%
Aug Fut Volume Change: -15.32%
Aug Fut Open Interest Analysis: Long Covering
MIDCPNIFTY SEPTEMBER Future closed at: 14753.8 (-0.183%)
Sep Fut Premium 77.15 (Decreased by -20.7 points)
Sep Fut Open Interest Change: 6.20%
Sep Fut Volume Change: -36.36%
Sep Fut Open Interest Analysis: Fresh Short
MIDCPNIFTY Monthly Expiry (25/08/2026) Option Analysis
Put-Call Ratio (Open Interest): 0.995 (Decreased from 1.040)
Put-Call Ratio (Volume): 0.847
Max Pain Level: 14625
Maximum CALL Open Interest: 15500
Maximum PUT Open Interest: 13600
Highest CALL Addition: 15500
Highest PUT Addition: 13600
SENSEX Monthly Expiry (27/08/2026) Future
SENSEX Spot closed at: 77,928.15 (0.352%)
SENSEX Monthly Future closed at: 78,064.50 (0.154%)
Premium: 136.35 (Decreased by -153.85 points)
Open Interest Change: 16.27%
Volume Change: 3.94%
Open Interest Analysis: Fresh Long
SENSEX Weekly Expiry (06/08/2026) Option Analysis
Put-Call Ratio (OI): 1.231 (Increased from 1.119)
Put-Call Ratio (Volume): 0.834
Max Pain Level: 77700
Maximum CALL OI: 80000
Maximum PUT OI: 77500
Highest CALL Addition: 77800
Highest PUT Addition: 77700
FII & DII Cash Market Activity
FIIs Net BUY: ₹3,623.51 Cr.
DIIs Net SELL: ₹ 1,864.03 Cr.
FII Derivatives Activity
| FII Trading Stats | 30.07.26 | 29.07.26 | 28.07.26 |
| FII Cash (Provisional Data) | 3,623.51 | 2,981.87 | 755.33 |
| Index Future Open Interest Long Ratio | 10.38% | 9.62% | 8.77% |
| Index Future Volume Long Ratio | 63.99% | 67.16% | 43.32% |
| Call Option Open Interest Long Ratio | 41.40% | 41.78% | 35.56% |
| Call Option Volume Long Ratio | 49.78% | 51.63% | 49.56% |
| Put Option Open Interest Long Ratio | 69.07% | 72.11% | 77.61% |
| Put Option Volume Long Ratio | 49.51% | 49.24% | 49.89% |
| Stock Future Open Interest Long Ratio | 54.88% | 54.90% | 54.36% |
| Stock Future Volume Long Ratio | 49.63% | 54.81% | 51.83% |
| Index Futures | Short Covering | Short Covering | Long Covering |
| Index Options | Fresh Short | Fresh Long | Long Covering |
| Nifty Futures | Short Covering | Short Covering | Long Covering |
| Nifty Options | Fresh Short | Fresh Long | Long Covering |
| BankNifty Futures | Fresh Short | Fresh Long | Long Covering |
| BankNifty Options | Fresh Long | Fresh Long | Long Covering |
| FinNifty Futures | Long Covering | Long Covering | Long Covering |
| FinNifty Options | Fresh Short | Fresh Long | Long Covering |
| MidcpNifty Futures | Short Covering | Fresh Short | Long Covering |
| MidcpNifty Options | Fresh Long | Fresh Long | Long Covering |
| NiftyNxt50 Futures | Long Covering | Fresh Long | Short Covering |
| NiftyNxt50 Options | Fresh Short | Fresh Long | Long Covering |
| Stock Futures | Long Covering | Short Covering | Short Covering |
| Stock Options | Fresh Short | Fresh Long | Long Covering |
NSE & BSE Option market Trends : Options Insights
SENSEX weekly Expiry (06/08/2026)
The SENSEX index closed at 77928.15. The SENSEX weekly expiry for AUGUST 6, 2026 has revealed key trends in open interest. The current Put/Call Ratio is at 1.231 against previous 1.119. The 80000CE option holds the maximum open interest, followed by the 79000CE and 77500PE options. Market participants have shown increased interest with significant open interest additions in the 77700PE option, with open interest additions also seen in the 77500PE and 76000PE options. On the other hand, open interest reductions were prominent in the 76900CE, 76800CE, and 70500PE options. Trading volume was highest in the 78000CE option, followed by the 77500PE and 77500CE options, indicating active trading in these strikes.
| SENSEX | Weekly | Expiry: | 06-08-2026 |
| Index Spot | PCR OI | Prev PCR OI | PCR VOL |
| 77928.15 | 1.231 | 1.119 | 0.834 |
| Total Open Interest Change in all CALLs & PUTs: | |||
| Current | Prior | Net Ch | |
| CALL: | 44,34,960 | 20,90,740 | 23,44,220 |
| PUT: | 54,58,400 | 23,40,180 | 31,18,220 |
| Top CALL Open Interest: | |||
| Strike | OI | OI Change | Volume |
| 80000 | 4,79,900 | 1,49,480 | 17,80,460 |
| 79000 | 4,35,040 | 66,660 | 18,27,460 |
| Top CALL Open Interest addition: | |||
| Strike | OI | OI Change | Volume |
| 77800 | 2,08,580 | 1,75,880 | 18,40,540 |
| 78000 | 2,70,360 | 1,66,660 | 28,46,640 |
| Top CALL Open Interest reduction: | |||
| Strike | OI | OI Change | Volume |
| 76900 | 7,000 | -4,300 | 28,080 |
| 76800 | 15,680 | -2,920 | 19,260 |
| Top CALL Volume: | |||
| Strike | OI | OI Change | Volume |
| 78000 | 2,70,360 | 1,66,660 | 28,46,640 |
| 77500 | 2,57,300 | 1,40,980 | 19,02,980 |
| Top PUT Open Interest: | |||
| Strike | OI | OI Change | Volume |
| 77500 | 3,98,320 | 2,35,740 | 25,30,840 |
| 77700 | 3,26,080 | 2,89,940 | 15,74,080 |
| Top PUT Open Interest addition: | |||
| Strike | OI | OI Change | Volume |
| 77700 | 3,26,080 | 2,89,940 | 15,74,080 |
| 77500 | 3,98,320 | 2,35,740 | 25,30,840 |
| Top PUT Open Interest reduction: | |||
| Strike | OI | OI Change | Volume |
| 70500 | 8,500 | -620 | 21,180 |
| 70600 | 240 | -360 | 600 |
| Top PUT Volume: | |||
| Strike | OI | OI Change | Volume |
| 77500 | 3,98,320 | 2,35,740 | 25,30,840 |
| 77700 | 3,26,080 | 2,89,940 | 15,74,080 |
NIFTY Weekly Expiry (04/08/2026)
The NIFTY index closed at 24317.15. The NIFTY weekly expiry for AUGUST 4, 2026 has revealed key trends in open interest. The current Put/Call Ratio is at 1.294 against previous 1.167. The 24000PE option holds the maximum open interest, followed by the 24200PE and 24600CE options. Market participants have shown increased interest with significant open interest additions in the 23400PE option, with open interest additions also seen in the 24300PE and 24500CE options. On the other hand, open interest reductions were prominent in the 23200PE, 24200CE, and 24450CE options. Trading volume was highest in the 24300CE option, followed by the 24200PE and 24250CE options, indicating active trading in these strikes.
| NIFTY | Weekly | Expiry: | 04-08-2026 |
| Index Spot | PCR OI | Prev PCR OI | PCR VOL |
| 24,317.15 | 1.294 | 1.167 | 0.873 |
| Total Open Interest Change in all CALLs & PUTs: | |||
| Current | Prior | Net Ch | |
| CALL: | 11,18,67,470 | 10,00,69,710 | 1,17,97,760 |
| PUT: | 14,47,17,235 | 11,67,81,860 | 2,79,35,375 |
| Top CALL Open Interest: | |||
| Strike | OI | OI Change | Volume |
| 24,600 | 1,01,78,415 | 29,53,015 | 12,83,227 |
| 24,500 | 99,84,000 | 31,18,830 | 17,73,049 |
| Top CALL Open Interest addition: | |||
| Strike | OI | OI Change | Volume |
| 24,500 | 99,84,000 | 31,18,830 | 17,73,049 |
| 24,600 | 1,01,78,415 | 29,53,015 | 12,83,227 |
| Top CALL Open Interest reduction: | |||
| Strike | OI | OI Change | Volume |
| 24,200 | 58,35,700 | -11,82,415 | 20,20,642 |
| 24,450 | 22,46,465 | -9,65,055 | 9,39,611 |
| Top CALL Volume: | |||
| Strike | OI | OI Change | Volume |
| 24,300 | 66,13,685 | 9,93,460 | 31,84,596 |
| 24,250 | 34,26,865 | 3,14,600 | 24,08,218 |
| Top PUT Open Interest: | |||
| Strike | OI | OI Change | Volume |
| 24,000 | 1,09,30,270 | 18,44,245 | 13,28,136 |
| 24,200 | 1,07,67,510 | 19,19,970 | 25,65,821 |
| Top PUT Open Interest addition: | |||
| Strike | OI | OI Change | Volume |
| 23,400 | 71,99,530 | 35,34,310 | 5,62,682 |
| 24,300 | 59,55,235 | 32,46,295 | 23,34,927 |
| Top PUT Open Interest reduction: | |||
| Strike | OI | OI Change | Volume |
| 23,200 | 46,71,615 | -15,28,475 | 4,14,612 |
| 21,600 | 40,12,905 | -7,14,415 | 68,767 |
| Top PUT Volume: | |||
| Strike | OI | OI Change | Volume |
| 24,200 | 1,07,67,510 | 19,19,970 | 25,65,821 |
| 24,300 | 59,55,235 | 32,46,295 | 23,34,927 |
NIFTY Monthly Expiry (25/08/2026)
The NIFTY index closed at 24317.15. The NIFTY monthly expiry for AUGUST 25, 2026 has revealed key trends in open interest. The current Put/Call Ratio is at 1.137 against previous 1.127. The 24000PE option holds the maximum open interest, followed by the 24000CE and 25000CE options. Market participants have shown increased interest with significant open interest additions in the 25000CE option, with open interest additions also seen in the 24300CE and 24000PE options. On the other hand, open interest reductions were prominent in the 23200PE, 24000CE, and 22500PE options. Trading volume was highest in the 25000CE option, followed by the 24000PE and 24500CE options, indicating active trading in these strikes.
| NIFTY | Monthly | Expiry: | 25-08-2026 |
| Index Spot | PCR OI | Prev PCR OI | PCR VOL |
| 24,317.15 | 1.137 | 1.127 | 1.125 |
| Total Open Interest Change in all CALLs & PUTs: | |||
| Current | Prior | Net Ch | |
| CALL: | 4,08,90,655 | 3,90,76,440 | 18,14,215 |
| PUT: | 4,65,10,165 | 4,40,41,725 | 24,68,440 |
| Top CALL Open Interest: | |||
| Strike | OI | OI Change | Volume |
| 24,000 | 62,73,280 | -1,26,750 | 24,825 |
| 25,000 | 52,78,520 | 5,12,590 | 83,570 |
| Top CALL Open Interest addition: | |||
| Strike | OI | OI Change | Volume |
| 25,000 | 52,78,520 | 5,12,590 | 83,570 |
| 24,300 | 17,61,305 | 3,61,855 | 54,552 |
| Top CALL Open Interest reduction: | |||
| Strike | OI | OI Change | Volume |
| 24,000 | 62,73,280 | -1,26,750 | 24,825 |
| 24,100 | 17,33,030 | -39,195 | 8,217 |
| Top CALL Volume: | |||
| Strike | OI | OI Change | Volume |
| 25,000 | 52,78,520 | 5,12,590 | 83,570 |
| 24,500 | 44,49,900 | 76,895 | 56,431 |
| Top PUT Open Interest: | |||
| Strike | OI | OI Change | Volume |
| 24,000 | 79,55,220 | 2,88,795 | 73,122 |
| 23,500 | 32,66,120 | 1,17,845 | 37,000 |
| Top PUT Open Interest addition: | |||
| Strike | OI | OI Change | Volume |
| 24,000 | 79,55,220 | 2,88,795 | 73,122 |
| 24,500 | 27,96,235 | 2,72,285 | 22,828 |
| Top PUT Open Interest reduction: | |||
| Strike | OI | OI Change | Volume |
| 23,200 | 7,87,150 | -2,20,155 | 13,675 |
| 22,500 | 15,03,125 | -46,150 | 14,338 |
| Top PUT Volume: | |||
| Strike | OI | OI Change | Volume |
| 24,000 | 79,55,220 | 2,88,795 | 73,122 |
| 24,200 | 20,08,435 | 1,61,980 | 46,663 |
BANKNIFTY Monthly Expiry (25/08/2026)
The BANKNIFTY index closed at 57147.5. The BANKNIFTY monthly expiry for AUGUST 25, 2026 has revealed key trends in open interest. The current Put/Call Ratio is at 0.885 against previous 0.897. The 58000CE option holds the maximum open interest, followed by the 58000PE and 60000CE options. Market participants have shown increased interest with significant open interest additions in the 57000CE option, with open interest additions also seen in the 59000CE and 60000CE options. On the other hand, open interest reductions were prominent in the 57200PE, 57400CE, and 55000CE options. Trading volume was highest in the 57000CE option, followed by the 57000PE and 58000CE options, indicating active trading in these strikes.
| BANKNIFTY | Monthly | Expiry: | 25-08-2026 |
| Index Spot | PCR OI | Prev PCR OI | PCR VOL |
| 57,147.50 | 0.885 | 0.897 | 0.889 |
| Total Open Interest Change in all CALLs & PUTs: | |||
| Current | Prior | Net Ch | |
| CALL: | 1,09,92,720 | 99,18,030 | 10,74,690 |
| PUT: | 97,26,720 | 88,98,930 | 8,27,790 |
| Top CALL Open Interest: | |||
| Strike | OI | OI Change | Volume |
| 58,000 | 21,25,440 | 74,220 | 59,136 |
| 60,000 | 11,20,260 | 1,12,440 | 37,686 |
| Top CALL Open Interest addition: | |||
| Strike | OI | OI Change | Volume |
| 57,000 | 8,03,940 | 1,37,340 | 1,28,866 |
| 59,000 | 9,85,620 | 1,14,540 | 48,263 |
| Top CALL Open Interest reduction: | |||
| Strike | OI | OI Change | Volume |
| 57,400 | 1,06,530 | -27,930 | 11,186 |
| 55,000 | 83,250 | -10,950 | 851 |
| Top CALL Volume: | |||
| Strike | OI | OI Change | Volume |
| 57,000 | 8,03,940 | 1,37,340 | 1,28,866 |
| 58,000 | 21,25,440 | 74,220 | 59,136 |
| Top PUT Open Interest: | |||
| Strike | OI | OI Change | Volume |
| 58,000 | 13,12,410 | -1,020 | 11,890 |
| 57,000 | 8,47,050 | 89,490 | 1,16,895 |
| Top PUT Open Interest addition: | |||
| Strike | OI | OI Change | Volume |
| 57,000 | 8,47,050 | 89,490 | 1,16,895 |
| 56,000 | 5,82,570 | 56,610 | 34,690 |
| Top PUT Open Interest reduction: | |||
| Strike | OI | OI Change | Volume |
| 57,200 | 1,47,180 | -67,950 | 32,026 |
| 53,600 | 27,030 | -5,940 | 2,009 |
| Top PUT Volume: | |||
| Strike | OI | OI Change | Volume |
| 57,000 | 8,47,050 | 89,490 | 1,16,895 |
| 56,900 | 1,38,870 | 39,210 | 50,761 |
MIDCPNIFTY Monthly Expiry (25/08/2026)
The MIDCPNIFTY index closed at 14676.65. The MIDCPNIFTY monthly expiry for AUGUST 25, 2026, 2025 has revealed key trends in open interest. The current Put/Call Ratio is at 0.995 against previous 1.040. The 15500CE option holds the maximum open interest, followed by the 13600PE and 14000PE options. Market participants have shown increased interest with significant open interest additions in the 13600PE option, with open interest additions also seen in the 13600PE and 15000CE options. On the other hand, open interest reductions were prominent in the 67300CE, 67300CE, and 67300PE options. Trading volume was highest in the 15000CE option, followed by the 14800CE and 14700CE options, indicating active trading in these strikes.
| MIDCPNIFTY | Monthly | Expiry: | 25-08-2026 |
| Index Spot | PCR OI | Prev PCR OI | PCR VOL |
| 14,676.65 | 0.995 | 1.040 | 0.847 |
| Total Open Interest Change in all CALLs & PUTs: | |||
| Current | Prior | Net Ch | |
| CALL: | 33,09,240 | 26,97,720 | 6,11,520 |
| PUT: | 32,91,120 | 28,06,080 | 4,85,040 |
| Top CALL Open Interest: | |||
| Strike | OI | OI Change | Volume |
| 15,500 | 6,64,680 | 1,72,080 | 4,908 |
| 15,000 | 3,36,000 | 1,28,520 | 11,936 |
| Top CALL Open Interest addition: | |||
| Strike | OI | OI Change | Volume |
| 15,500 | 6,64,680 | 1,72,080 | 4,908 |
| 15,000 | 3,36,000 | 1,28,520 | 11,936 |
| Top CALL Open Interest reduction: | |||
| Strike | OI | OI Change | Volume |
| 14,700 | 2,90,280 | -10,440 | 9,134 |
| 14,600 | 1,14,600 | -1,200 | 2,599 |
| Top CALL Volume: | |||
| Strike | OI | OI Change | Volume |
| 15,000 | 3,36,000 | 1,28,520 | 11,936 |
| 14,800 | 3,05,280 | 1,12,200 | 11,295 |
| Top PUT Open Interest: | |||
| Strike | OI | OI Change | Volume |
| 13,600 | 4,54,200 | 1,72,080 | 3,196 |
| 14,000 | 4,22,160 | -1,560 | 4,158 |
| Top PUT Open Interest addition: | |||
| Strike | OI | OI Change | Volume |
| 13,600 | 4,54,200 | 1,72,080 | 3,196 |
| 13,800 | 2,41,200 | 60,360 | 2,018 |
| Top PUT Open Interest reduction: | |||
| Strike | OI | OI Change | Volume |
| 14,625 | 24,720 | -8,040 | 813 |
| 13,300 | 12,720 | -3,960 | 194 |
| Top PUT Volume: | |||
| Strike | OI | OI Change | Volume |
| 14,700 | 1,95,600 | 39,600 | 8,122 |
| 14,300 | 1,22,520 | 37,440 | 7,950 |
Conclusion: What the NSE & BSE Indices Futures and Options Open Interest Volume Analysis Tells Us
So, how do we actually trade this complex setup going into the upcoming sessions? Based on the heavy divergences uncovered in our Open Interest Volume Analysis, you need to be highly selective with your underlying assets. Here is your actionable trading plan and the clear reasoning behind it:
Buy the dips in Nifty & Sensex: Nifty’s Put-Call Ratio (PCR) has climbed to a healthy 1.294, with a rock-solid put base sitting at 24,000 protecting the downside. Look for entry opportunities if Nifty dips toward the 24,250 Max Pain level, targeting the heavy resistance zone at 24,500–24,600. For aggressive momentum, Sensex is your best long vehicle as long as it defends the 77,700 max pain level.
Fade the rallies in BankNifty: The data here is overtly bearish. With fresh short positions added and the PCR dropping to 0.885, any bounce toward the 57,500 Max Pain level—or the heavy call writing ceiling at 58,000—should be viewed as a high-probability shorting opportunity.
Watch the 57,000 BankNifty battleground: Notice that the highest call and put additions both happened exactly at 57,000. Option writers are currently straddling this level. If BankNifty decisively breaks and sustains below 57,000, expect a sharp, aggressive slide as those put writers run for cover.
Step aside on Midcaps for now: With the data transitioning from long covering to fresh shorts, the momentum is stalling. The risk-reward just isn’t there to force aggressive trades in this pocket until new support is firmly established around the 13,600 max put OI zone.
Check Previous Day’s NSE & BSE Indices F&O Analysis
FII / FPI trading activity in Capital Market Segment
NSE Derivatives Raw Data
BSE Derivatives Raw Data
Disclaimer
fnodata.com is a financial blog providing research-based data and analysis. The content creator of the fnodata.com is not a SEBI registered Investment Advisor. The content on this blog is for informational purposes only and should not be considered as investment advice. You are responsible for your own investment decisions. You should consult with a financial advisor or conduct your own research before making any investment decisions.