Turning Complex Derivative Data into Clear Market Insights

NSE & BSE Indices Futures and Options Open Interest Volume Analysis for 25/08/2026

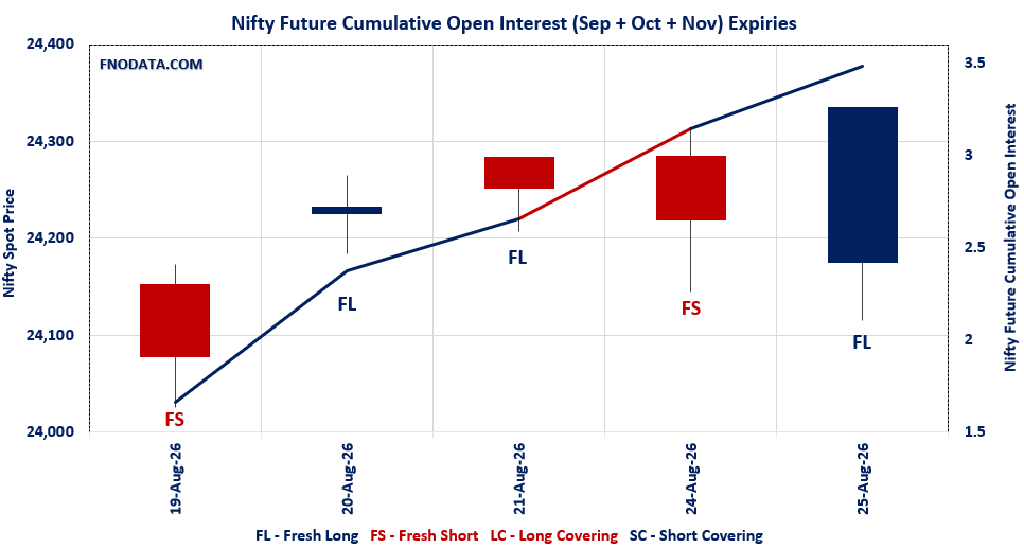
Table of Contents
Today’s Open Interest Volume Analysis for August 25, 2026, reveals a textbook bullish setup. We are seeing massive fresh long buildups across the board, backed by expanding futures premiums that signal high institutional confidence. Instead of guessing the market’s next move, let’s dive right into what the derivative data is actually telling us:
Nifty is Flexing Serious Muscle: We are looking at a massive ~34% spike in combined futures Open Interest alongside a 32-point premium jump in the September contract. This screams “Fresh Longs.” Plus, with the Put-Call Ratio (PCR) climbing to 1.159 and aggressive put writers building a fortress at 24,200, the bulls have a very comfortable cushion beneath them.
BankNifty’s High-Stakes Standoff: While Nifty trends, BankNifty is caught in an intense tug-of-war exactly at the 57,500 mark. Both Call and Put writers have piled their maximum OI right at this strike, creating a massive straddle zone. However, the staggering 328-point premium in September futures suggests that the broader underlying bias is still looking upward.
Sensex Short-Covering Squeeze: Ahead of its August 27 expiry, Sensex is witnessing classic short covering. Futures OI has dropped by nearly 14% while prices rose, and the PCR has violently shifted from 0.771 to a highly bullish 1.429. Bears are scrambling to cover, and put writers are aggressively defending the 77,500 zone.
NSE & BSE F&O Market Signals
NIFTY Future analysis
NIFTY Spot closed at: 24334.55 (0.477%)
Combined = September + October + November
Combined Fut Open Interest Change: 33.96%
Combined Fut Volume Change: 34.51%
Combined Fut Open Interest Analysis: Fresh Long
Rollover: 8% Previous 8%
NIFTY SEPTEMBER Future closed at: 24471.7 (0.607%)
Sep Fut Premium 137.15 (Increased by 32.1 points)
Sep Fut Open Interest Change: 34.09%
Sep Fut Volume Change: 31.53%
Sep Fut Open Interest Analysis: Fresh Long
NIFTY OCTOBER Future closed at: 24590.4 (0.608%)
Oct Fut Premium 255.85 (Increased by 33 points)
Oct Fut Open Interest Change: 32.50%
Oct Fut Volume Change: 84.50%
Oct Fut Open Interest Analysis: Fresh Long
NIFTY Weekly Expiry (01/09/2026) Option Analysis
Put-Call Ratio (Open Interest): 1.159 (Increased from 0.908)
Put-Call Ratio (Volume): 0.916
Max Pain Level: 24300
Maximum CALL Open Interest: 24500
Maximum PUT Open Interest: 24200
Highest CALL Addition: 24500
Highest PUT Addition: 24200
NIFTY Monthly Expiry (29/09/2026) Option Analysis
Put-Call Ratio (Open Interest): 1.237 (Increased from 1.233)
Put-Call Ratio (Volume): 0.978
Max Pain Level: 24500
Maximum CALL Open Interest: 25000
Maximum PUT Open Interest: 24000
Highest CALL Addition: 24000
Highest PUT Addition: 24000
BANKNIFTY Future Analysis
BANKNIFTY Spot closed at: 57514.2 (-0.020%)
Combined = September + October + November
Combined Fut Open Interest Change: 37.74%
Combined Fut Volume Change: 12.57%
Combined Fut Open Interest Analysis: Fresh Short
Rollover: 5% Previous 6%
BANKNIFTY SEPTEMBER Future closed at: 57842.2 (0.149%)
Sep Fut Premium 328 (Increased by 97.55 points)
Sep Fut Open Interest Change: 38.5%
Sep Fut Volume Change: 13.1%
Sep Fut Open Interest Analysis: Fresh Long
BANKNIFTY OCTOBER Future closed at: 58178.6 (0.158%)
Oct Fut Premium 664.4 (Increased by 103.75 points)
Oct Fut Open Interest Change: 24.78%
Oct Fut Volume Change: 2.57%
Oct Fut Open Interest Analysis: Fresh Long
BANKNIFTY Monthly Expiry (29/09/2026) Option Analysis
Put-Call Ratio (Open Interest): 1.153 (Decreased from 1.238)
Put-Call Ratio (Volume): 0.801
Max Pain Level: 57500
Maximum CALL Open Interest: 57500
Maximum PUT Open Interest: 57500
Highest CALL Addition: 57500
Highest PUT Addition: 57500
MIDCPNIFTY Future Analysis
MIDCPNIFTY Spot closed at: 15000.9 (0.687%)
Combined = September + October + November
Combined Fut Open Interest Change: 21.97%
Combined Fut Volume Change: 9.13%
Combined Fut Open Interest Analysis: Fresh Long
Rollover: 2% Previous 2%
MIDCPNIFTY SEPTEMBER Future closed at: 15035.6 (0.932%)
Sep Fut Premium 34.7 (Increased by 36.4 points)
Sep Fut Open Interest Change: 21.84%
Sep Fut Volume Change: 7.45%
Sep Fut Open Interest Analysis: Fresh Long
MIDCPNIFTY OCTOBER Future closed at: 15095.6 (0.925%)
Oct Fut Premium 94.7 (Increased by 35.9 points)
Oct Fut Open Interest Change: 29.57%
Oct Fut Volume Change: 160.00%
Oct Fut Open Interest Analysis: Fresh Long
MIDCPNIFTY Monthly Expiry (29/09/2026) Option Analysis
Put-Call Ratio (Open Interest): 1.232 (Decreased from 1.661)
Put-Call Ratio (Volume): 0.973
Max Pain Level: 15000
Maximum CALL Open Interest: 15000
Maximum PUT Open Interest: 15000
Highest CALL Addition: 16000
Highest PUT Addition: 14900
SENSEX Monthly Expiry (27/08/2026) Future
SENSEX Spot closed at: 77,656.09 (0.371%)
SENSEX Monthly Future closed at: 77,839.00 (0.468%)
Premium: 182.91 (Increased by 75.57 points)
Open Interest Change: -13.92%
Volume Change: 90.30%
Open Interest Analysis: Short Covering
SENSEX Weekly Expiry (27/08/2026) Option Analysis
Put-Call Ratio (OI): 1.429 (Increased from 0.771)
Put-Call Ratio (Volume): 0.976
Max Pain Level: 77600
Maximum CALL OI: 78000
Maximum PUT OI: 77500
Highest CALL Addition: 78000
Highest PUT Addition: 77000
fII & DII Cash Market Activity
FIIs Net BUY: ₹ 1,593.53 Cr.
DIIs Net BUY: ₹ 230.26 Cr.
FII Derivatives Activity
| FII Trading Stats | 25.08.26 | 24.08.26 | 21.08.26 |
| FII Cash (Provisional Data) | 1,593.53 | 1,181.66 | -542.71 |
| Index Future Open Interest Long Ratio | 10.29% | 9.90% | 9.95% |
| Index Future Volume Long Ratio | 45.15% | 46.83% | 51.25% |
| Call Option Open Interest Long Ratio | 38.52% | 44.66% | 42.37% |
| Call Option Volume Long Ratio | 50.57% | 50.11% | 50.23% |
| Put Option Open Interest Long Ratio | 75.23% | 66.62% | 63.39% |
| Put Option Volume Long Ratio | 49.72% | 50.70% | 49.87% |
| Stock Future Open Interest Long Ratio | 54.79% | 55.20% | 55.14% |
| Stock Future Volume Long Ratio | 52.30% | 50.03% | 50.17% |
| Index Futures | Long Covering | Fresh Short | Fresh Long |
| Index Options | Short Covering | Fresh Long | Fresh Long |
| Nifty Futures | Long Covering | Fresh Short | Fresh Long |
| Nifty Options | Short Covering | Fresh Long | Fresh Long |
| BankNifty Futures | Long Covering | Long Covering | Short Covering |
| BankNifty Options | Long Covering | Fresh Short | Fresh Short |
| FinNifty Futures | Short Covering | Fresh Short | Fresh Short |
| FinNifty Options | Long Covering | Long Covering | Fresh Long |
| MidcpNifty Futures | Short Covering | Short Covering | Fresh Short |
| MidcpNifty Options | Long Covering | Fresh Long | Fresh Long |
| NiftyNxt50 Futures | Long Covering | Fresh Short | Long Covering |
| NiftyNxt50 Options | Short Covering | Fresh Long | Fresh Long |
| Stock Futures | Short Covering | Short Covering | Fresh Long |
| Stock Options | Long Covering | Long Covering | Long Covering |
NSE & BSE Option market Trends : Options Insights
SENSEX weekly Expiry (27/08/2026)
The SENSEX index closed at 77656.09. The SENSEX weekly expiry for AUGUST 27, 2026 has revealed key trends in open interest. The current Put/Call Ratio is at 1.429 against previous 0.771. The 77500PE option holds the maximum open interest, followed by the 77000PE and 75000PE options. Market participants have shown increased interest with significant open interest additions in the 77000PE option, with open interest additions also seen in the 77500PE and 75000PE options. On the other hand, open interest reductions were prominent in the 77700CE, 77600CE, and 77500CE options. Trading volume was highest in the 77300PE option, followed by the 77200PE and 77500CE options, indicating active trading in these strikes.
| SENSEX | Weekly | Expiry: | 27-08-2026 |
| Index Spot | PCR OI | Prev PCR OI | PCR VOL |
| 77656.09 | 1.429 | 0.771 | 0.976 |
| Total Open Interest Change in all CALLs & PUTs: | |||
| Current | Prior | Net Ch | |
| CALL: | 1,66,97,520 | 1,50,88,240 | 16,09,280 |
| PUT: | 2,38,58,560 | 1,16,26,740 | 1,22,31,820 |
| Top CALL Open Interest: | |||
| Strike | OI | OI Change | Volume |
| 78000 | 13,87,920 | 4,45,100 | 2,08,36,520 |
| 79000 | 11,67,080 | 4,28,100 | 1,01,54,020 |
| Top CALL Open Interest addition: | |||
| Strike | OI | OI Change | Volume |
| 78000 | 13,87,920 | 4,45,100 | 2,08,36,520 |
| 79000 | 11,67,080 | 4,28,100 | 1,01,54,020 |
| Top CALL Open Interest reduction: | |||
| Strike | OI | OI Change | Volume |
| 77700 | 4,93,660 | -4,20,840 | 1,53,49,840 |
| 77600 | 3,98,060 | -2,89,120 | 1,53,83,860 |
| Top CALL Volume: | |||
| Strike | OI | OI Change | Volume |
| 77500 | 8,42,520 | -2,81,200 | 2,52,01,140 |
| 78000 | 13,87,920 | 4,45,100 | 2,08,36,520 |
| Top PUT Open Interest: | |||
| Strike | OI | OI Change | Volume |
| 77500 | 17,35,280 | 10,30,500 | 2,02,25,040 |
| 77000 | 16,32,740 | 10,66,620 | 2,14,99,920 |
| Top PUT Open Interest addition: | |||
| Strike | OI | OI Change | Volume |
| 77000 | 16,32,740 | 10,66,620 | 2,14,99,920 |
| 77500 | 17,35,280 | 10,30,500 | 2,02,25,040 |
| Top PUT Open Interest reduction: | |||
| Strike | OI | OI Change | Volume |
| 70000 | 1,56,300 | -1,09,420 | 4,90,460 |
| 72000 | 2,04,660 | -60,940 | 11,09,980 |
| Top PUT Volume: | |||
| Strike | OI | OI Change | Volume |
| 77300 | 11,47,920 | 5,49,700 | 2,81,88,860 |
| 77200 | 10,45,600 | 6,71,540 | 2,62,71,260 |
NIFTY Weekly Expiry (1/09/2026)
The NIFTY index closed at 24334.55. The NIFTY weekly expiry for SEPTEMBER 1, 2026 has revealed key trends in open interest. The current Put/Call Ratio is at 1.159 against previous 0.908. The 24200PE option holds the maximum open interest, followed by the 24500CE and 25000CE options. Market participants have shown increased interest with significant open interest additions in the 24200PE option, with open interest additions also seen in the 24100PE and 23400PE options. On the other hand, open interest reductions were prominent in the 22600PE, 22450PE, and 22400PE options. Trading volume was highest in the 24200PE option, followed by the 24200CE and 24100PE options, indicating active trading in these strikes.
| NIFTY | Weekly | Expiry: | 01-09-2026 |
| Index Spot | PCR OI | Prev PCR OI | PCR VOL |
| 24,334.55 | 1.159 | 0.908 | 0.916 |
| Total Open Interest Change in all CALLs & PUTs: | |||
| Current | Prior | Net Ch | |
| CALL: | 6,98,83,255 | 4,90,37,625 | 2,08,45,630 |
| PUT: | 8,09,77,455 | 4,45,45,735 | 3,64,31,720 |
| Top CALL Open Interest: | |||
| Strike | OI | OI Change | Volume |
| 24,500 | 54,65,980 | 20,44,250 | 4,47,240 |
| 25,000 | 52,33,475 | 15,10,145 | 2,30,614 |
| Top CALL Open Interest addition: | |||
| Strike | OI | OI Change | Volume |
| 24,500 | 54,65,980 | 20,44,250 | 4,47,240 |
| 24,800 | 52,08,450 | 18,94,230 | 2,51,543 |
| Top CALL Open Interest reduction: | |||
| Strike | OI | OI Change | Volume |
| 24,900 | 19,48,180 | -10,270 | 2,00,103 |
| 26,450 | 2,405 | -65 | 8 |
| Top CALL Volume: | |||
| Strike | OI | OI Change | Volume |
| 24,200 | 38,20,960 | 8,51,760 | 6,01,923 |
| 24,300 | 37,78,125 | 3,70,045 | 4,95,035 |
| Top PUT Open Interest: | |||
| Strike | OI | OI Change | Volume |
| 24,200 | 73,25,500 | 48,12,795 | 7,00,607 |
| 22,000 | 48,75,195 | 14,42,545 | 74,506 |
| Top PUT Open Interest addition: | |||
| Strike | OI | OI Change | Volume |
| 24,200 | 73,25,500 | 48,12,795 | 7,00,607 |
| 24,100 | 40,28,050 | 27,87,915 | 5,15,660 |
| Top PUT Open Interest reduction: | |||
| Strike | OI | OI Change | Volume |
| 22,600 | 2,32,115 | -33,280 | 13,507 |
| 22,450 | 42,770 | -13,390 | 2,434 |
| Top PUT Volume: | |||
| Strike | OI | OI Change | Volume |
| 24,200 | 73,25,500 | 48,12,795 | 7,00,607 |
| 24,100 | 40,28,050 | 27,87,915 | 5,15,660 |
NIFTY Monthly Expiry (29/09/2026)
The NIFTY index closed at 24334.55. The NIFTY monthly expiry for SEPTEMBER 29, 2026 has revealed key trends in open interest. The current Put/Call Ratio is at 1.237 against previous 1.233. The 24000PE option holds the maximum open interest, followed by the 25000CE and 24500CE options. Market participants have shown increased interest with significant open interest additions in the 24000PE option, with open interest additions also seen in the 24000CE and 24200CE options. On the other hand, open interest reductions were prominent in the 25700CE, 24400CE, and 24500CE options. Trading volume was highest in the 24500CE option, followed by the 24000PE and 24200PE options, indicating active trading in these strikes.
| NIFTY | Monthly | Expiry: | 29-09-2026 |
| Index Spot | PCR OI | Prev PCR OI | PCR VOL |
| 24,334.55 | 1.237 | 1.233 | 0.978 |
| Total Open Interest Change in all CALLs & PUTs: | |||
| Current | Prior | Net Ch | |
| CALL: | 4,31,43,075 | 3,99,39,680 | 32,03,395 |
| PUT: | 5,33,81,500 | 4,92,47,930 | 41,33,570 |
| Top CALL Open Interest: | |||
| Strike | OI | OI Change | Volume |
| 25,000 | 50,80,400 | 2,68,905 | 58,830 |
| 24,500 | 43,88,800 | -56,940 | 76,681 |
| Top CALL Open Interest addition: | |||
| Strike | OI | OI Change | Volume |
| 24,000 | 27,35,785 | 5,31,830 | 36,767 |
| 24,200 | 20,26,180 | 4,18,860 | 51,523 |
| Top CALL Open Interest reduction: | |||
| Strike | OI | OI Change | Volume |
| 25,700 | 3,08,425 | -1,27,140 | 6,294 |
| 24,400 | 21,21,600 | -1,11,735 | 34,854 |
| Top CALL Volume: | |||
| Strike | OI | OI Change | Volume |
| 24,500 | 43,88,800 | -56,940 | 76,681 |
| 25,000 | 50,80,400 | 2,68,905 | 58,830 |
| Top PUT Open Interest: | |||
| Strike | OI | OI Change | Volume |
| 24,000 | 52,99,155 | 6,06,095 | 70,772 |
| 23,000 | 40,47,105 | 1,99,820 | 24,670 |
| Top PUT Open Interest addition: | |||
| Strike | OI | OI Change | Volume |
| 24,000 | 52,99,155 | 6,06,095 | 70,772 |
| 24,200 | 26,07,800 | 3,71,995 | 60,634 |
| Top PUT Open Interest reduction: | |||
| Strike | OI | OI Change | Volume |
| 19,500 | 8,55,075 | -51,610 | 2,975 |
| 24,400 | 20,01,285 | -26,910 | 30,987 |
| Top PUT Volume: | |||
| Strike | OI | OI Change | Volume |
| 24,000 | 52,99,155 | 6,06,095 | 70,772 |
| 24,200 | 26,07,800 | 3,71,995 | 60,634 |
BANKNIFTY Monthly Expiry (29/09/2026)
The BANKNIFTY index closed at 57514.2. The BANKNIFTY monthly expiry for SEPTEMBER 29, 2026 has revealed key trends in open interest. The current Put/Call Ratio is at 1.153 against previous 1.238. The 57500CE option holds the maximum open interest, followed by the 57500PE and 58000CE options. Market participants have shown increased interest with significant open interest additions in the 57500CE option, with open interest additions also seen in the 57500PE and 58000CE options. On the other hand, open interest reductions were prominent in the 46500PE, 49500PE, and 58600PE options. Trading volume was highest in the 57500CE option, followed by the 57500PE and 58000CE options, indicating active trading in these strikes.
| BANKNIFTY | Monthly | Expiry: | 29-09-2026 |
| Index Spot | PCR OI | Prev PCR OI | PCR VOL |
| 57,514.20 | 1.153 | 1.238 | 0.801 |
| Total Open Interest Change in all CALLs & PUTs: | |||
| Current | Prior | Net Ch | |
| CALL: | 81,26,550 | 60,09,870 | 21,16,680 |
| PUT: | 93,70,740 | 74,42,520 | 19,28,220 |
| Top CALL Open Interest: | |||
| Strike | OI | OI Change | Volume |
| 57,500 | 18,13,230 | 5,14,950 | 67,767 |
| 58,000 | 10,19,670 | 2,81,640 | 48,050 |
| Top CALL Open Interest addition: | |||
| Strike | OI | OI Change | Volume |
| 57,500 | 18,13,230 | 5,14,950 | 67,767 |
| 58,000 | 10,19,670 | 2,81,640 | 48,050 |
| Top CALL Open Interest reduction: | |||
| Strike | OI | OI Change | Volume |
| 63,900 | – | – | – |
| 63,900 | – | – | – |
| Top CALL Volume: | |||
| Strike | OI | OI Change | Volume |
| 57,500 | 18,13,230 | 5,14,950 | 67,767 |
| 58,000 | 10,19,670 | 2,81,640 | 48,050 |
| Top PUT Open Interest: | |||
| Strike | OI | OI Change | Volume |
| 57,500 | 16,96,740 | 3,14,790 | 62,874 |
| 58,000 | 8,32,410 | 2,61,120 | 27,509 |
| Top PUT Open Interest addition: | |||
| Strike | OI | OI Change | Volume |
| 57,500 | 16,96,740 | 3,14,790 | 62,874 |
| 58,000 | 8,32,410 | 2,61,120 | 27,509 |
| Top PUT Open Interest reduction: | |||
| Strike | OI | OI Change | Volume |
| 46,500 | 16,920 | -660 | 130 |
| 49,500 | 25,620 | -480 | 56 |
| Top PUT Volume: | |||
| Strike | OI | OI Change | Volume |
| 57,500 | 16,96,740 | 3,14,790 | 62,874 |
| 58,000 | 8,32,410 | 2,61,120 | 27,509 |
MIDCPNIFTY Monthly Expiry (29/09/2026)
The MIDCPNIFTY index closed at 15000.9. The MIDCPNIFTY monthly expiry for SEPTEMBER 29, 2026, 2025 has revealed key trends in open interest. The current Put/Call Ratio is at 1.232 against previous 1.661. The 15000PE option holds the maximum open interest, followed by the 14000PE and 15000CE options. Market participants have shown increased interest with significant open interest additions in the 14900PE option, with open interest additions also seen in the 16000CE and 14900CE options. On the other hand, open interest reductions were prominent in the 70600CE, 70600CE, and 70600PE options. Trading volume was highest in the 15000CE option, followed by the 14900PE and 14900CE options, indicating active trading in these strikes.
| MIDCPNIFTY | Monthly | Expiry: | 29-09-2026 |
| Index Spot | PCR OI | Prev PCR OI | PCR VOL |
| 15,000.90 | 1.232 | 1.661 | 0.973 |
| Total Open Interest Change in all CALLs & PUTs: | |||
| Current | Prior | Net Ch | |
| CALL: | 11,71,560 | 6,51,840 | 5,19,720 |
| PUT: | 14,43,840 | 10,82,760 | 3,61,080 |
| Top CALL Open Interest: | |||
| Strike | OI | OI Change | Volume |
| 15,000 | 3,20,280 | 79,920 | 5,122 |
| 16,000 | 2,66,400 | 1,33,080 | 2,386 |
| Top CALL Open Interest addition: | |||
| Strike | OI | OI Change | Volume |
| 16,000 | 2,66,400 | 1,33,080 | 2,386 |
| 14,900 | 1,70,040 | 96,240 | 4,361 |
| Top CALL Open Interest reduction: | |||
| Strike | OI | OI Change | Volume |
| 16,400 | – | – | – |
| 16,400 | – | – | – |
| Top CALL Volume: | |||
| Strike | OI | OI Change | Volume |
| 15,000 | 3,20,280 | 79,920 | 5,122 |
| 14,900 | 1,70,040 | 96,240 | 4,361 |
| Top PUT Open Interest: | |||
| Strike | OI | OI Change | Volume |
| 15,000 | 3,99,360 | 65,640 | 3,930 |
| 14,000 | 3,20,400 | 54,000 | 2,211 |
| Top PUT Open Interest addition: | |||
| Strike | OI | OI Change | Volume |
| 14,900 | 2,18,640 | 1,49,640 | 4,834 |
| 15,000 | 3,99,360 | 65,640 | 3,930 |
| Top PUT Open Interest reduction: | |||
| Strike | OI | OI Change | Volume |
| 14,500 | 2,24,280 | -2,280 | 2,690 |
| 15,375 | – | – | – |
| Top PUT Volume: | |||
| Strike | OI | OI Change | Volume |
| 14,900 | 2,18,640 | 1,49,640 | 4,834 |
| 15,000 | 3,99,360 | 65,640 | 3,930 |
Conclusion: What the NSE & BSE Indices Futures and Options Open Interest Volume Analysis Tells Us
So, how do we turn this raw data into profitable trades? Based on our deep Open Interest Volume Analysis, the overarching market structure heavily favors a “buy on dips” approach, provided you respect the key options boundaries. Here is your actionable feedback and clear reasoning for the upcoming sessions:
NIFTY Trade Plan: The trend is your friend here. With Max Pain at 24,300 and the highest put additions at 24,200, any intraday dip toward the 24,250–24,300 zone is a prime buying opportunity. Keep your upside targets strictly near 24,500, as call writers are heavily defending that ceiling for this week.
BANKNIFTY Trade Plan: Patience pays off here. Do not get chopped up in the 57,500 straddle trap. Wait for a decisive 15-minute candle close above 57,500 to ride the momentum, or look for a low-risk entry if the index dips to test underlying supports. The massive futures premium tells us not to fight the larger trend by shorting blindly.
SENSEX Expiry Setup: The massive jump in PCR and aggressive short-covering makes Sensex a prime candidate for a bullish expiry. Stay heavily biased toward the long side as long as the index sustains above the 77,600 Max Pain level, with trailing stop-losses placed just under the 77,500 put-writer support.
The Bottom Line: When you see a simultaneous rise in price, futures volume, Open Interest, and contract premiums across Nifty, Midcap, and BankNifty, it indicates smart money is rolling over into fresh longs. Keep your stock-specific longs active, respect your stop-losses at the Max Pain levels, and trade the data!
Check Previous Day’s NSE & BSE Indices F&O Analysis
FII / FPI trading activity in Capital Market Segment
NSE Derivatives Raw Data
BSE Derivatives Raw Data
Disclaimer
fnodata.com is a financial blog providing research-based data and analysis. The content creator of the fnodata.com is not a SEBI registered Investment Advisor. The content on this blog is for informational purposes only and should not be considered as investment advice. You are responsible for your own investment decisions. You should consult with a financial advisor or conduct your own research before making any investment decisions.