Turning Complex Derivative Data into Clear Market Insights

NSE & BSE Indices Futures and Options Open Interest Volume Analysis for 27/08/2026

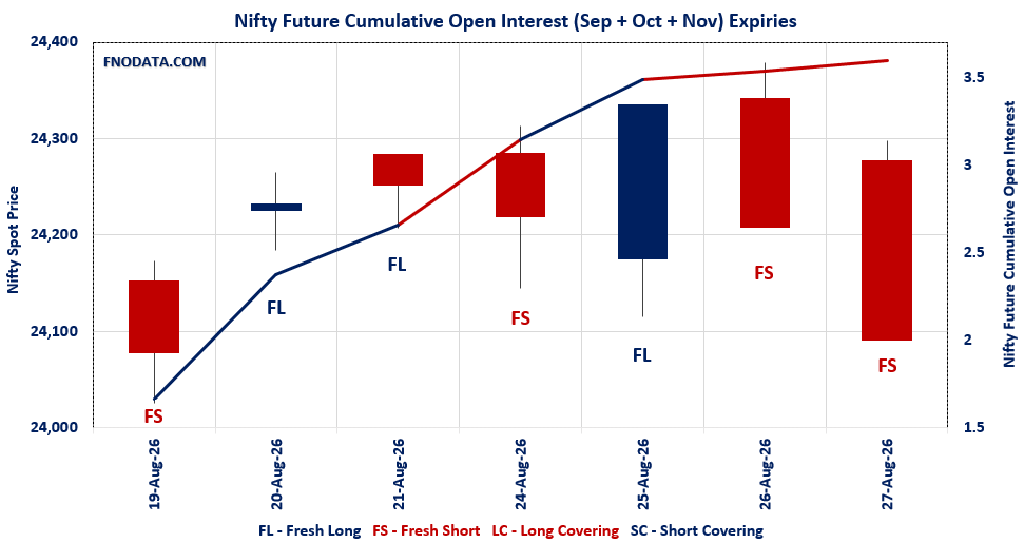
Table of Contents
Welcome to today’s derivatives breakdown. If you are tracking market positioning, our Open Interest Volume Analysis for the 27th August 2026 session shows the headline indices closing under pressure, but the underlying data reveals a far more complex tug-of-war beneath the surface.
Headline Price Action vs. Positioning: NIFTY Spot slipped -0.483% to settle at 24,090.85, accompanied by a +6.23% combined futures open interest buildup on contracting volumes (-2.97%), pointing to tactical fresh short additions across September and October contracts.
Banking Sector Divergence: BANKNIFTY closed at 57,509.95 (-0.474%), yet its September futures saw long unwinding (-0.40% OI) alongside a sharp volume contraction of -34.20%, indicating a lack of aggressive selling conviction from institutional bears in the near month.
Broader Market Resilience: MIDCPNIFTY held virtually flat at 14,948.85 (+0.005%) with combined futures adding +2.24% fresh longs, while SENSEX futures saw massive volume expansion (+195.31%) and premium expansion (+116 points) even as the spot corrected to 76,933.59.
Derivatives Regime: While the surface trend looks decisively weak, our cross-segment Open Interest Volume Analysis highlights critical structural anomalies—particularly skewed Put-Call ratios and elevated Max Pain levels—that traders must navigate before blindly pressing the sell button.
NSE & BSE F&O Market Signals
NIFTY Future analysis
NIFTY Spot closed at: 24090.85 (-0.483%)
Combined = September + October + November
Combined Fut Open Interest Change: 6.23%
Combined Fut Volume Change: -2.97%
Combined Fut Open Interest Analysis: Fresh Short
Rollover: 9% Previous 8%
NIFTY SEPTEMBER Future closed at: 24281.9 (-0.603%)
Sep Fut Premium 191.05 (Decreased by -30.3 points)
Sep Fut Open Interest Change: 5.45%
Sep Fut Volume Change: -6.38%
Sep Fut Open Interest Analysis: Fresh Short
NIFTY OCTOBER Future closed at: 24404.5 (-0.641%)
Oct Fut Premium 313.65 (Decreased by -40.6 points)
Oct Fut Open Interest Change: 4.16%
Oct Fut Volume Change: 8.47%
Oct Fut Open Interest Analysis: Fresh Short
NIFTY Weekly Expiry (01/09/2026) Option Analysis
Put-Call Ratio (Open Interest): 0.593 (Decreased from 0.733)
Put-Call Ratio (Volume): 1.019
Max Pain Level: 24200
Maximum CALL Open Interest: 24300
Maximum PUT Open Interest: 24000
Highest CALL Addition: 24200
Highest PUT Addition: 23800
NIFTY Monthly Expiry (29/09/2026) Option Analysis
Put-Call Ratio (Open Interest): 1.175 (Decreased from 1.203)
Put-Call Ratio (Volume): 0.838
Max Pain Level: 24400
Maximum CALL Open Interest: 25000
Maximum PUT Open Interest: 24000
Highest CALL Addition: 24300
Highest PUT Addition: 24300
BANKNIFTY Future Analysis
BANKNIFTY Spot closed at: 57509.95 (-0.474%)
Combined = September + October + November
Combined Fut Open Interest Change: 0.06%
Combined Fut Volume Change: -34.18%
Combined Fut Open Interest Analysis: Fresh Short
Rollover: 6% Previous 6%
BANKNIFTY SEPTEMBER Future closed at: 57902.6 (-0.547%)
Sep Fut Premium 392.65 (Decreased by -44.8 points)
Sep Fut Open Interest Change: -0.4%
Sep Fut Volume Change: -34.2%
Sep Fut Open Interest Analysis: Long Covering
BANKNIFTY OCTOBER Future closed at: 58244.4 (-0.505%)
Oct Fut Premium 734.45 (Decreased by -22 points)
Oct Fut Open Interest Change: 3.32%
Oct Fut Volume Change: -43.34%
Oct Fut Open Interest Analysis: Fresh Short
BANKNIFTY Monthly Expiry (29/09/2026) Option Analysis
Put-Call Ratio (Open Interest): 1.096 (Decreased from 1.145)
Put-Call Ratio (Volume): 1.047
Max Pain Level: 57800
Maximum CALL Open Interest: 57500
Maximum PUT Open Interest: 57500
Highest CALL Addition: 58000
Highest PUT Addition: 56000
MIDCPNIFTY Future Analysis
MIDCPNIFTY Spot closed at: 14948.85 (0.005%)
Combined = September + October + November
Combined Fut Open Interest Change: 2.24%
Combined Fut Volume Change: -8.90%
Combined Fut Open Interest Analysis: Fresh Long
Rollover: 2% Previous 2%
MIDCPNIFTY SEPTEMBER Future closed at: 14986.8 (-0.260%)
Sep Fut Premium 37.95 (Decreased by -39.9 points)
Sep Fut Open Interest Change: 1.99%
Sep Fut Volume Change: -6.70%
Sep Fut Open Interest Analysis: Fresh Short
MIDCPNIFTY OCTOBER Future closed at: 15035.55 (-0.212%)
Oct Fut Premium 86.7 (Decreased by -32.8 points)
Oct Fut Open Interest Change: 13.60%
Oct Fut Volume Change: -37.50%
Oct Fut Open Interest Analysis: Fresh Short
MIDCPNIFTY Monthly Expiry (29/09/2026) Option Analysis
Put-Call Ratio (Open Interest): 1.077 (Increased from 1.057)
Put-Call Ratio (Volume): 0.991
Max Pain Level: 15000
Maximum CALL Open Interest: 15000
Maximum PUT Open Interest: 14000
Highest CALL Addition: 15500
Highest PUT Addition: 14000
SENSEX Monthly Expiry (24/09/2026) Future
SENSEX Spot closed at: 76,933.59 (-0.696%)
SENSEX Monthly Future closed at: 77,854.25 (-0.541%)
Premium: 920.66 (Increased by 116 points)
Open Interest Change: 126.72%
Volume Change: 195.31%
Open Interest Analysis: Fresh Short
SENSEX Weekly Expiry (03/09/2026) Option Analysis
Put-Call Ratio (OI): 0.877 (Decreased from 1.009)
Put-Call Ratio (Volume): 1.095
Max Pain Level: 77500
Maximum CALL OI: 78000
Maximum PUT OI: 75000
Highest CALL Addition: 77500
Highest PUT Addition: 77500
fII & DII Cash Market Activity
FIIs Net SELL: ₹ 298.26 Cr.
DIIs Net BUY: ₹ 4,977.17 Cr.
FII Derivatives Activity
| FII Trading Stats | 27.08.26 | 26.08.26 | 25.08.26 |
| FII Cash (Provisional Data) | -298.26 | 502.63 | 1,593.53 |
| Index Future Open Interest Long Ratio | 9.83% | 10.81% | 10.29% |
| Index Future Volume Long Ratio | 29.06% | 45.71% | 45.15% |
| Call Option Open Interest Long Ratio | 39.53% | 39.31% | 38.52% |
| Call Option Volume Long Ratio | 49.60% | 49.38% | 50.57% |
| Put Option Open Interest Long Ratio | 73.60% | 73.58% | 75.23% |
| Put Option Volume Long Ratio | 50.95% | 50.09% | 49.72% |
| Stock Future Open Interest Long Ratio | 54.30% | 54.52% | 54.79% |
| Stock Future Volume Long Ratio | 47.01% | 46.53% | 52.30% |
| Index Futures | Fresh Short | Fresh Short | Long Covering |
| Index Options | Fresh Long | Fresh Short | Short Covering |
| Nifty Futures | Fresh Short | Fresh Short | Long Covering |
| Nifty Options | Fresh Long | Fresh Short | Short Covering |
| BankNifty Futures | Long Covering | Fresh Long | Long Covering |
| BankNifty Options | Fresh Long | Fresh Long | Long Covering |
| FinNifty Futures | Fresh Short | Fresh Short | Short Covering |
| FinNifty Options | Fresh Long | Fresh Short | Long Covering |
| MidcpNifty Futures | Short Covering | Fresh Short | Short Covering |
| MidcpNifty Options | Fresh Long | Fresh Long | Long Covering |
| NiftyNxt50 Futures | Long Covering | Fresh Short | Long Covering |
| NiftyNxt50 Options | Fresh Short | Fresh Long | Short Covering |
| Stock Futures | Long Covering | Fresh Short | Short Covering |
| Stock Options | Fresh Short | Fresh Short | Long Covering |
NSE & BSE Option market Trends : Options Insights
SENSEX weekly Expiry (27/08/2026)
The SENSEX index closed at 76933.59. The SENSEX weekly expiry for SEPTEMBER 3, 2026 has revealed key trends in open interest. The current Put/Call Ratio is at 0.877 against previous 1.009. The 78000CE option holds the maximum open interest, followed by the 77500CE and 75000PE options. Market participants have shown increased interest with significant open interest additions in the 77500CE option, with open interest additions also seen in the 78000CE and 79000CE options. On the other hand, open interest reductions were prominent in the 80500CE, 77800PE, and 76300PE options. Trading volume was highest in the 77000PE option, followed by the 77500CE and 77500PE options, indicating active trading in these strikes.
| SENSEX | Weekly | Expiry: | 03-09-2026 |
| Index Spot | PCR OI | Prev PCR OI | PCR VOL |
| 76933.59 | 0.877 | 1.009 | 1.095 |
| Total Open Interest Change in all CALLs & PUTs: | |||
| Current | Prior | Net Ch | |
| CALL: | 46,94,360 | 20,52,300 | 26,42,060 |
| PUT: | 41,17,640 | 20,71,600 | 20,46,040 |
| Top CALL Open Interest: | |||
| Strike | OI | OI Change | Volume |
| 78000 | 6,03,560 | 2,78,040 | 19,70,360 |
| 77500 | 4,99,940 | 3,88,060 | 23,48,080 |
| Top CALL Open Interest addition: | |||
| Strike | OI | OI Change | Volume |
| 77500 | 4,99,940 | 3,88,060 | 23,48,080 |
| 78000 | 6,03,560 | 2,78,040 | 19,70,360 |
| Top CALL Open Interest reduction: | |||
| Strike | OI | OI Change | Volume |
| 80500 | 1,64,520 | -56,240 | 6,58,120 |
| 81800 | 1,560 | – | 1,500 |
| Top CALL Volume: | |||
| Strike | OI | OI Change | Volume |
| 77500 | 4,99,940 | 3,88,060 | 23,48,080 |
| 78000 | 6,03,560 | 2,78,040 | 19,70,360 |
| Top PUT Open Interest: | |||
| Strike | OI | OI Change | Volume |
| 75000 | 4,37,780 | 1,68,560 | 14,36,280 |
| 77500 | 3,75,860 | 2,06,080 | 22,33,080 |
| Top PUT Open Interest addition: | |||
| Strike | OI | OI Change | Volume |
| 77500 | 3,75,860 | 2,06,080 | 22,33,080 |
| 75500 | 2,70,820 | 1,73,660 | 14,47,680 |
| Top PUT Open Interest reduction: | |||
| Strike | OI | OI Change | Volume |
| 77800 | 50,920 | -22,440 | 3,07,040 |
| 76300 | 30,780 | -940 | 2,94,120 |
| Top PUT Volume: | |||
| Strike | OI | OI Change | Volume |
| 77000 | 2,53,120 | 1,32,140 | 24,45,540 |
| 77500 | 3,75,860 | 2,06,080 | 22,33,080 |
NIFTY Weekly Expiry (1/09/2026)
The NIFTY index closed at 24090.85. The NIFTY weekly expiry for SEPTEMBER 1, 2026 has revealed key trends in open interest. The current Put/Call Ratio is at 0.593 against previous 0.733. The 24300CE option holds the maximum open interest, followed by the 24500CE and 24400CE options. Market participants have shown increased interest with significant open interest additions in the 24200CE option, with open interest additions also seen in the 25500CE and 24300CE options. On the other hand, open interest reductions were prominent in the 24350PE, 24300PE, and 24750CE options. Trading volume was highest in the 24200PE option, followed by the 24200CE and 24150PE options, indicating active trading in these strikes.
| NIFTY | Weekly | Expiry: | 01-09-2026 |
| Index Spot | PCR OI | Prev PCR OI | PCR VOL |
| 24,090.85 | 0.593 | 0.733 | 1.019 |
| Total Open Interest Change in all CALLs & PUTs: | |||
| Current | Prior | Net Ch | |
| CALL: | 18,51,13,370 | 12,76,99,520 | 5,74,13,850 |
| PUT: | 10,97,76,225 | 9,36,31,720 | 1,61,44,505 |
| Top CALL Open Interest: | |||
| Strike | OI | OI Change | Volume |
| 24,300 | 1,32,16,450 | 43,70,665 | 22,17,212 |
| 24,500 | 1,25,38,045 | 21,46,105 | 13,11,554 |
| Top CALL Open Interest addition: | |||
| Strike | OI | OI Change | Volume |
| 24,200 | 99,89,720 | 63,38,865 | 23,85,908 |
| 25,500 | 1,19,46,480 | 55,24,025 | 4,95,866 |
| Top CALL Open Interest reduction: | |||
| Strike | OI | OI Change | Volume |
| 24,750 | 29,48,075 | -6,03,720 | 2,94,315 |
| 26,000 | 40,17,325 | -1,10,760 | 1,41,301 |
| Top CALL Volume: | |||
| Strike | OI | OI Change | Volume |
| 24,200 | 99,89,720 | 63,38,865 | 23,85,908 |
| 24,300 | 1,32,16,450 | 43,70,665 | 22,17,212 |
| Top PUT Open Interest: | |||
| Strike | OI | OI Change | Volume |
| 24,000 | 71,05,670 | 14,70,755 | 16,98,841 |
| 23,500 | 69,60,980 | 15,82,035 | 4,67,606 |
| Top PUT Open Interest addition: | |||
| Strike | OI | OI Change | Volume |
| 23,800 | 63,44,585 | 17,87,890 | 7,06,345 |
| 22,500 | 60,35,510 | 17,49,280 | 1,55,846 |
| Top PUT Open Interest reduction: | |||
| Strike | OI | OI Change | Volume |
| 24,350 | 16,60,100 | -9,24,170 | 4,95,662 |
| 24,300 | 49,42,600 | -8,54,230 | 17,83,737 |
| Top PUT Volume: | |||
| Strike | OI | OI Change | Volume |
| 24,200 | 65,76,570 | 3,78,625 | 34,31,628 |
| 24,150 | 35,26,250 | 12,00,680 | 23,80,385 |
NIFTY Monthly Expiry (29/09/2026)
The NIFTY index closed at 24090.85. The NIFTY monthly expiry for SEPTEMBER 29, 2026 has revealed key trends in open interest. The current Put/Call Ratio is at 1.175 against previous 1.203. The 25000CE option holds the maximum open interest, followed by the 24000PE and 24500CE options. Market participants have shown increased interest with significant open interest additions in the 24300CE option, with open interest additions also seen in the 24200CE and 24300PE options. On the other hand, open interest reductions were prominent in the 25300CE, 25200CE, and 24450PE options. Trading volume was highest in the 25000CE option, followed by the 24500CE and 24300CE options, indicating active trading in these strikes.
| NIFTY | Monthly | Expiry: | 29-09-2026 |
| Index Spot | PCR OI | Prev PCR OI | PCR VOL |
| 24,090.85 | 1.175 | 1.203 | 0.838 |
| Total Open Interest Change in all CALLs & PUTs: | |||
| Current | Prior | Net Ch | |
| CALL: | 5,08,92,220 | 4,71,48,870 | 37,43,350 |
| PUT: | 5,97,92,655 | 5,67,27,775 | 30,64,880 |
| Top CALL Open Interest: | |||
| Strike | OI | OI Change | Volume |
| 25,000 | 57,97,350 | 3,25,390 | 66,134 |
| 24,500 | 55,78,105 | 4,75,020 | 53,835 |
| Top CALL Open Interest addition: | |||
| Strike | OI | OI Change | Volume |
| 24,300 | 40,48,200 | 6,46,685 | 47,579 |
| 24,200 | 26,05,785 | 6,15,095 | 44,164 |
| Top CALL Open Interest reduction: | |||
| Strike | OI | OI Change | Volume |
| 25,300 | 8,42,205 | -86,710 | 12,230 |
| 25,200 | 11,30,415 | -54,080 | 21,389 |
| Top CALL Volume: | |||
| Strike | OI | OI Change | Volume |
| 25,000 | 57,97,350 | 3,25,390 | 66,134 |
| 24,500 | 55,78,105 | 4,75,020 | 53,835 |
| Top PUT Open Interest: | |||
| Strike | OI | OI Change | Volume |
| 24,000 | 56,11,350 | 84,630 | 45,058 |
| 24,500 | 47,70,805 | 2,19,440 | 31,498 |
| Top PUT Open Interest addition: | |||
| Strike | OI | OI Change | Volume |
| 24,300 | 39,23,140 | 5,16,035 | 44,216 |
| 23,000 | 45,29,460 | 3,62,895 | 32,725 |
| Top PUT Open Interest reduction: | |||
| Strike | OI | OI Change | Volume |
| 24,450 | 94,185 | -41,990 | 2,008 |
| 25,000 | 22,25,880 | -24,960 | 4,206 |
| Top PUT Volume: | |||
| Strike | OI | OI Change | Volume |
| 24,000 | 56,11,350 | 84,630 | 45,058 |
| 24,300 | 39,23,140 | 5,16,035 | 44,216 |
BANKNIFTY Monthly Expiry (29/09/2026)
The BANKNIFTY index closed at 57509.95. The BANKNIFTY monthly expiry for SEPTEMBER 29, 2026 has revealed key trends in open interest. The current Put/Call Ratio is at 1.096 against previous 1.145. The 57500CE option holds the maximum open interest, followed by the 57500PE and 58000CE options. Market participants have shown increased interest with significant open interest additions in the 58000CE option, with open interest additions also seen in the 57800CE and 57600CE options. On the other hand, open interest reductions were prominent in the 58300PE, 61000CE, and 56700CE options. Trading volume was highest in the 58000CE option, followed by the 58000PE and 57800PE options, indicating active trading in these strikes.
| BANKNIFTY | Monthly | Expiry: | 29-09-2026 |
| Index Spot | PCR OI | Prev PCR OI | PCR VOL |
| 57,509.95 | 1.096 | 1.145 | 1.047 |
| Total Open Interest Change in all CALLs & PUTs: | |||
| Current | Prior | Net Ch | |
| CALL: | 1,07,55,750 | 98,80,410 | 8,75,340 |
| PUT: | 1,17,88,200 | 1,13,12,160 | 4,76,040 |
| Top CALL Open Interest: | |||
| Strike | OI | OI Change | Volume |
| 57,500 | 18,29,550 | 35,970 | 30,585 |
| 58,000 | 12,68,580 | 1,96,980 | 92,383 |
| Top CALL Open Interest addition: | |||
| Strike | OI | OI Change | Volume |
| 58,000 | 12,68,580 | 1,96,980 | 92,383 |
| 57,800 | 2,88,750 | 1,12,710 | 47,755 |
| Top CALL Open Interest reduction: | |||
| Strike | OI | OI Change | Volume |
| 61,000 | 4,65,810 | -78,630 | 24,062 |
| 56,700 | 25,710 | -40,260 | 2,693 |
| Top CALL Volume: | |||
| Strike | OI | OI Change | Volume |
| 58,000 | 12,68,580 | 1,96,980 | 92,383 |
| 57,800 | 2,88,750 | 1,12,710 | 47,755 |
| Top PUT Open Interest: | |||
| Strike | OI | OI Change | Volume |
| 57,500 | 17,63,550 | 20,340 | 50,844 |
| 58,000 | 11,51,760 | 39,750 | 85,918 |
| Top PUT Open Interest addition: | |||
| Strike | OI | OI Change | Volume |
| 56,000 | 6,72,780 | 86,340 | 31,648 |
| 54,500 | 1,26,780 | 63,810 | 10,336 |
| Top PUT Open Interest reduction: | |||
| Strike | OI | OI Change | Volume |
| 58,300 | 97,800 | -82,290 | 9,830 |
| 58,200 | 85,200 | -35,940 | 13,559 |
| Top PUT Volume: | |||
| Strike | OI | OI Change | Volume |
| 58,000 | 11,51,760 | 39,750 | 85,918 |
| 57,800 | 1,76,100 | -4,950 | 65,143 |
MIDCPNIFTY Monthly Expiry (29/09/2026)
The MIDCPNIFTY index closed at 14948.85. The MIDCPNIFTY monthly expiry for SEPTEMBER 29, 2026, 2025 has revealed key trends in open interest. The current Put/Call Ratio is at 1.077 against previous 1.057. The 14000PE option holds the maximum open interest, followed by the 15000PE and 15000CE options. Market participants have shown increased interest with significant open interest additions in the 14000PE option, with open interest additions also seen in the 15500CE and 15000PE options. On the other hand, open interest reductions were prominent in the 66800PE, 66800PE, and 66800PE options. Trading volume was highest in the 15000CE option, followed by the 14000PE and 15000PE options, indicating active trading in these strikes.
| MIDCPNIFTY | Monthly | Expiry: | 29-09-2026 |
| Index Spot | PCR OI | Prev PCR OI | PCR VOL |
| 14,948.85 | 1.077 | 1.057 | 0.991 |
| Total Open Interest Change in all CALLs & PUTs: | |||
| Current | Prior | Net Ch | |
| CALL: | 25,98,840 | 20,52,120 | 5,46,720 |
| PUT: | 27,99,960 | 21,69,240 | 6,30,720 |
| Top CALL Open Interest: | |||
| Strike | OI | OI Change | Volume |
| 15,000 | 5,14,440 | 78,600 | 8,189 |
| 16,000 | 3,95,400 | -11,760 | 1,833 |
| Top CALL Open Interest addition: | |||
| Strike | OI | OI Change | Volume |
| 15,500 | 2,68,440 | 1,66,680 | 4,846 |
| 15,300 | 1,26,720 | 1,01,880 | 4,619 |
| Top CALL Open Interest reduction: | |||
| Strike | OI | OI Change | Volume |
| 15,050 | 39,600 | -13,800 | 876 |
| 16,000 | 3,95,400 | -11,760 | 1,833 |
| Top CALL Volume: | |||
| Strike | OI | OI Change | Volume |
| 15,000 | 5,14,440 | 78,600 | 8,189 |
| 15,500 | 2,68,440 | 1,66,680 | 4,846 |
| Top PUT Open Interest: | |||
| Strike | OI | OI Change | Volume |
| 14,000 | 7,95,720 | 2,08,200 | 7,585 |
| 15,000 | 5,83,320 | 1,21,200 | 7,508 |
| Top PUT Open Interest addition: | |||
| Strike | OI | OI Change | Volume |
| 14,000 | 7,95,720 | 2,08,200 | 7,585 |
| 15,000 | 5,83,320 | 1,21,200 | 7,508 |
| Top PUT Open Interest reduction: | |||
| Strike | OI | OI Change | Volume |
| 14,900 | 1,60,320 | -10,680 | 3,630 |
| 15,050 | 28,800 | -5,040 | 621 |
| Top PUT Volume: | |||
| Strike | OI | OI Change | Volume |
| 14,000 | 7,95,720 | 2,08,200 | 7,585 |
| 15,000 | 5,83,320 | 1,21,200 | 7,508 |
Conclusion: What the NSE & BSE Indices Futures and Options Open Interest Volume Analysis Tells Us
The surface-level data screams bearish continuation, but diving deeper into the Open Interest Volume Analysis reveals several high-probability warning flags against initiating aggressive fresh short positions at current levels:
Extreme Weekly PCR Oversold Territory: NIFTY’s weekly Put-Call Ratio (OI) has plummeted to 0.593 (down from 0.733). Historically, sub-0.60 PCR readings signal heavily stretched short positions and option skew, leaving late short sellers vulnerable to violent, mean-reverting short-covering spikes.
Max Pain Gravity Pulls Higher Across the Board: Spot levels across every major index are trading noticeably below their respective Max Pain strikes (NIFTY Weekly at 24,200 vs. 24,090 spot; BANKNIFTY at 57,800 vs. 57,509 spot; SENSEX at 77,500 vs. 76,933 spot). This gap suggests option writers will fight to pull spot prices higher into expiry.
Firm Strike Congestion at Key Floors: Maximum Put Open Interest remains anchored at 24,000 for NIFTY and 57,500 for BANKNIFTY, setting up immediate, high-density demand zones where downside momentum is likely to stall.
Actionable Execution Plan:
Avoid shorting into key support (24,000 NIFTY / 57,500 BANKNIFTY) or chasing breakdowns where the risk-reward ratio is skewed negatively.
Look for tactical intraday bounce plays toward the Max Pain clusters (24,200–24,250 zone on NIFTY).
If you hold short bias, wait for failed pullbacks near heavy Call addition zones (24,200–24,300) rather than taking fresh shorts at the bottom of the current range.
Check Previous Day’s NSE & BSE Indices F&O Analysis
FII / FPI trading activity in Capital Market Segment
NSE Derivatives Raw Data
BSE Derivatives Raw Data
Disclaimer
fnodata.com is a financial blog providing research-based data and analysis. The content creator of the fnodata.com is not a SEBI registered Investment Advisor. The content on this blog is for informational purposes only and should not be considered as investment advice. You are responsible for your own investment decisions. You should consult with a financial advisor or conduct your own research before making any investment decisions.