Turning Complex Derivative Data into Clear Market Insights

NSE & BSE Indices Futures and Options Open Interest Volume Analysis for 28/01/2026

Table of Contents
The derivative structure going into 28th January clearly shows bullish intent with selective caution, and this is where Open Interest Volume Analysis becomes crucial for traders planning the day.
NIFTY, BANKNIFTY, and MIDCPNIFTY all witnessed fresh long build-up or short covering in futures, but the sharp drop in volumes across contracts indicates that smart money is positioning without chasing price — a classic sign of controlled accumulation rather than emotional buying.
In NIFTY, both February and March futures saw OI addition with falling volumes, confirming that longs are getting built quietly at higher levels, while the falling premium suggests traders are hedged and not overly aggressive yet.
Weekly options show NIFTY is being magnetized around 25300 (max pain), with heavy call writing at 26000 and fresh put writing at 25300 — signaling a range-bound but upward-biased opening unless this call wall is broken.
BANKNIFTY’s strong OI expansion (nearly 7%) with lower volumes is a textbook fresh-long signal, but the 60000 strike acting as both max pain and maximum OI on both sides clearly marks it as the battle zone for the day.
MIDCPNIFTY stands out with aggressive short covering in February and fresh longs in March, showing risk-on sentiment returning to midcaps, supported by rising PCR and expanding put additions.
Overall, Open Interest Volume Analysis suggests the market is preparing for an upside attempt, but traders should expect slow, rotational movement rather than a one-way rally during the opening hours.
NSE & BSE F&O Market Signals
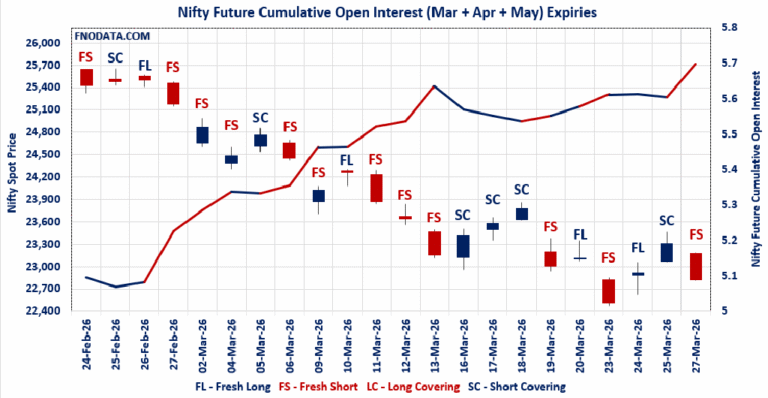
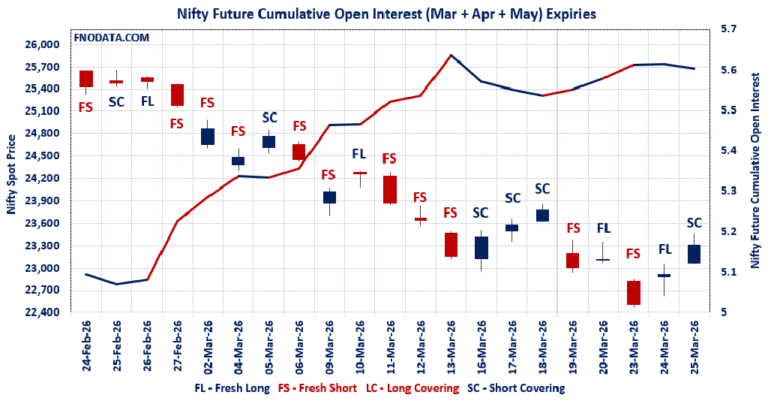
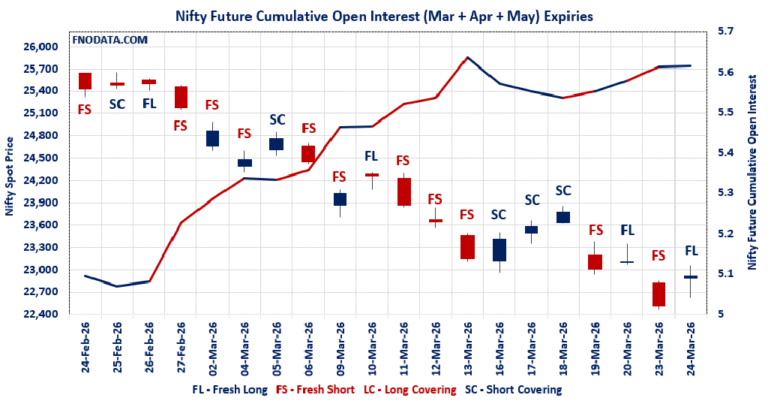
NIFTY Future analysis
NIFTY Spot closed at: 25342.75 (0.665%)
Combined = February + March + April
Combined Fut Open Interest Change: 2.60%
Combined Fut Volume Change: -31.55%
Combined Fut Open Interest Analysis: Fresh Long
Rollover: 7% Previous 7%
NIFTY FEBRUARY Future closed at: 25450.4 (0.267%)
February Fut Premium 107.65 (Decreased by -99.55 points)
February Fut Open Interest Change: 2.10%
February Fut Volume Change: -33.06%
February Fut Open Interest Analysis: Fresh Long
NIFTY March Future closed at: 25630.3 (0.239%)
March Fut Premium 287.55 (Decreased by -106.35 points)
March Fut Open Interest Change: 3.92%
March Fut Volume Change: -28.89%
March Fut Open Interest Analysis: Fresh Long
NIFTY Weekly Expiry (3/02/2026) Option Analysis
Put-Call Ratio (Open Interest): 0.826 (Decreased from 0.834)
Put-Call Ratio (Volume): 0.936
Max Pain Level: 25300
Maximum CALL Open Interest: 26000
Maximum PUT Open Interest: 23300
Highest CALL Addition: 26000
Highest PUT Addition: 25300
NIFTY Monthly Expiry (24/02/2026) Option Analysis
Put-Call Ratio (Open Interest): 1.096 (Increased from 1.093)
Put-Call Ratio (Volume): 0.971
Max Pain Level: 25500
Maximum CALL Open Interest: 26000
Maximum PUT Open Interest: 25000
Highest CALL Addition: 26000
Highest PUT Addition: 24500
BANKNIFTY Future Analysis
BANKNIFTY Spot closed at: 59598.8 (0.664%)
Combined = February + March + April
Combined Fut Open Interest Change: 6.98%
Combined Fut Volume Change: -24.56%
Combined Fut Open Interest Analysis: Fresh Long
Rollover: 8% Previous 8%
BANKNIFTY FEBRUARY Future closed at: 59866.4 (0.397%)
February Fut Premium 267.6 (Decreased by -156.55 points)
February Fut Open Interest Change: 7.5%
February Fut Volume Change: -24.8%
February Fut Open Interest Analysis: Fresh Long
BANKNIFTY MARCH Future closed at: 60243.8 (0.400%)
March Fut Premium 645 (Decreased by -153.35 points)
March Fut Open Interest Change: -1.45%
March Fut Volume Change: -34.28%
March Fut Open Interest Analysis: Short Covering
BANKNIFTY Monthly Expiry (24/02/2026) Option Analysis
Put-Call Ratio (Open Interest): 1.098 (Increased from 1.073)
Put-Call Ratio (Volume): 0.937
Max Pain Level: 60000
Maximum CALL Open Interest: 60000
Maximum PUT Open Interest: 60000
Highest CALL Addition: 59500
Highest PUT Addition: 59000
MIDCPNIFTY Future Analysis
MIDCPNIFTY Spot closed at: 13381.9 (1.857%)
Combined = February + March + April
Combined Fut Open Interest Change: -1.46%
Combined Fut Volume Change: -43.95%
Combined Fut Open Interest Analysis: Short Covering
Rollover: 3% Previous 2%
MIDCPNIFTY FEBRUARY Future closed at: 13409.05 (1.459%)
February Fut Premium 27.15 (Decreased by -51.15 points)
February Fut Open Interest Change: -1.72%
February Fut Volume Change: -44.19%
February Fut Open Interest Analysis: Short Covering
MIDCPNIFTY MARCH Future closed at: 13476.6 (1.230%)
March Fut Premium 94.7 (Decreased by -80.25 points)
March Fut Open Interest Change: 5.28%
March Fut Volume Change: -46.32%
March Fut Open Interest Analysis: Fresh Long
MIDCPNIFTY Monthly Expiry (24/02/2026) Option Analysis
Put-Call Ratio (Open Interest): 1.137 (Increased from 1.064)
Put-Call Ratio (Volume): 0.858
Max Pain Level: 13300
Maximum CALL Open Interest: 14000
Maximum PUT Open Interest: 13000
Highest CALL Addition: 14500
Highest PUT Addition: 12500
SENSEX Monthly Expiry (29/01/2026) Future
SENSEX Spot closed at: 82,344.68 (0.595%)
SENSEX Monthly Future closed at: 82,394.80 (0.372%)
Premium: 50.12 (Decreased by -181.8 points)
Open Interest Change: -7.20%
Volume Change: 20.00%
Open Interest Analysis: Short Covering
SENSEX Weekly Expiry (29/01/2026) Option Analysis
Put-Call Ratio (OI): 0.975 (Increased from 0.966)
Put-Call Ratio (Volume): 0.991
Max Pain Level: 82300
Maximum CALL OI: 84000
Maximum PUT OI: 80000
Highest CALL Addition: 83000
Highest PUT Addition: 80000
FII & DII Cash Market Activity
FIIs Net BUY: ₹ 480.26 Cr.
DIIs Net BUY: ₹ 3,360.59 Cr.
FII Derivatives Activity
| FII Trading Stats | 28.01.26 | 27.01.26 | 23.01.26 |
| FII Cash (Provisional Data) | 480.26 | -3,068.49 | -3,262.82 |
| Index Future Open Interest Long Ratio | 12.62% | 11.85% | 14.67% |
| Index Future Volume Long Ratio | 51.19% | 44.54% | 46.73% |
| Call Option Open Interest Long Ratio | 43.24% | 43.16% | 49.22% |
| Call Option Volume Long Ratio | 49.73% | 50.30% | 50.30% |
| Put Option Open Interest Long Ratio | 67.34% | 69.93% | 60.90% |
| Put Option Volume Long Ratio | 50.19% | 49.69% | 50.17% |
| Stock Future Open Interest Long Ratio | 61.87% | 62.02% | 61.26% |
| Stock Future Volume Long Ratio | 49.18% | 52.90% | 49.98% |
| Index Futures | Fresh Long | Long Covering | Fresh Short |
| Index Options | Fresh Short | Long Covering | Fresh Long |
| Nifty Futures | Fresh Long | Long Covering | Fresh Short |
| Nifty Options | Fresh Short | Short Covering | Fresh Long |
| BankNifty Futures | Short Covering | Short Covering | Fresh Short |
| BankNifty Options | Fresh Long | Long Covering | Fresh Long |
| FinNifty Futures | Long Covering | Fresh Short | Long Covering |
| FinNifty Options | Fresh Short | Short Covering | Fresh Short |
| MidcpNifty Futures | Fresh Long | Short Covering | Fresh Long |
| MidcpNifty Options | Fresh Long | Long Covering | Fresh Long |
| NiftyNxt50 Futures | Fresh Short | Long Covering | Short Covering |
| NiftyNxt50 Options | Fresh Long | Short Covering | Fresh Long |
| Stock Futures | Fresh Short | Short Covering | Short Covering |
| Stock Options | Fresh Short | Long Covering | Short Covering |
Fresh Long: Net Buy with Increase in Open Interest
Fresh Short: Net Sell with Increase in Open Interest
Short Covering: Net Buy with Decrease in Open Interest
Long Covering: Net Sell with Decrease in Open Interest
NSE & BSE Option market Trends : Options Insights
SENSEX Weekly Expiry (29/01/2026)
The SENSEX index closed at 82344.68. The SENSEX weekly expiry for JANUARY 29, 2026 has revealed key trends in open interest. The current Put/Call Ratio is at 0.975 against previous 0.966. The 84000CE option holds the maximum open interest, followed by the 83000CE and 83500CE options. Market participants have shown increased interest with significant open interest additions in the 83000CE option, with open interest additions also seen in the 84000CE and 83500CE options. On the other hand, open interest reductions were prominent in the 78500PE, 81500CE, and 82000CE options. Trading volume was highest in the 83000CE option, followed by the 82000PE and 82500CE options, indicating active trading in these strikes.
| SENSEX | Weekly | Expiry: | 29-01-2026 |
| Index Spot | PCR OI | Prev PCR OI | PCR VOL |
| 82344.68 | 0.975 | 0.966 | 0.991 |
| Total Open Interest Change in all CALLs & PUTs: | |||
| Current | Prior | Net Ch | |
| CALL: | 3,67,96,520 | 2,05,74,420 | 1,62,22,100 |
| PUT: | 3,58,76,480 | 1,98,75,940 | 1,60,00,540 |
| Top CALL Open Interest: | |||
| Strike | OI | OI Change | Volume |
| 84000 | 28,19,980 | 12,25,340 | 3,82,25,480 |
| 83000 | 26,18,360 | 12,61,680 | 15,93,49,960 |
| Top CALL Open Interest addition: | |||
| Strike | OI | OI Change | Volume |
| 83000 | 26,18,360 | 12,61,680 | 15,93,49,960 |
| 84000 | 28,19,980 | 12,25,340 | 3,82,25,480 |
| Top CALL Open Interest reduction: | |||
| Strike | OI | OI Change | Volume |
| 81500 | 1,43,260 | -1,82,040 | 33,27,940 |
| 82000 | 5,71,780 | -1,80,020 | 6,62,59,580 |
| Top CALL Volume: | |||
| Strike | OI | OI Change | Volume |
| 83000 | 26,18,360 | 12,61,680 | 15,93,49,960 |
| 82500 | 18,11,780 | 8,22,800 | 13,97,01,440 |
| Top PUT Open Interest: | |||
| Strike | OI | OI Change | Volume |
| 80000 | 22,30,560 | 10,21,460 | 3,03,82,300 |
| 81000 | 18,25,060 | 9,11,280 | 9,46,79,800 |
| Top PUT Open Interest addition: | |||
| Strike | OI | OI Change | Volume |
| 80000 | 22,30,560 | 10,21,460 | 3,03,82,300 |
| 82000 | 16,54,360 | 10,19,900 | 15,38,22,600 |
| Top PUT Open Interest reduction: | |||
| Strike | OI | OI Change | Volume |
| 78500 | 7,78,720 | -1,82,760 | 98,02,060 |
| 76000 | 4,48,460 | -63,040 | 22,52,740 |
| Top PUT Volume: | |||
| Strike | OI | OI Change | Volume |
| 82000 | 16,54,360 | 10,19,900 | 15,38,22,600 |
| 81500 | 15,05,160 | 6,63,560 | 12,61,71,720 |
NIFTY Weekly Expiry (3/02/2026)
The NIFTY index closed at 25342.75. The NIFTY weekly expiry for FEBRUARY 3, 2026 has revealed key trends in open interest. The current Put/Call Ratio is at 0.826 against previous 0.834. The 26000CE option holds the maximum open interest, followed by the 23300PE and 27000CE options. Market participants have shown increased interest with significant open interest additions in the 25300PE option, with open interest additions also seen in the 26000CE and 23300PE options. On the other hand, open interest reductions were prominent in the 25100CE, 25200CE, and 25000CE options. Trading volume was highest in the 25300PE option, followed by the 25300CE and 25200PE options, indicating active trading in these strikes.
| NIFTY | Weekly | Expiry: | 03-02-2026 |
| Index Spot | PCR OI | Prev PCR OI | PCR VOL |
| 25,342.75 | 0.826 | 0.834 | 0.936 |
| Total Open Interest Change in all CALLs & PUTs: | |||
| Current | Prior | Net Ch | |
| CALL: | 9,74,85,765 | 5,82,23,425 | 3,92,62,340 |
| PUT: | 8,04,84,820 | 4,85,81,455 | 3,19,03,365 |
| Top CALL Open Interest: | |||
| Strike | OI | OI Change | Volume |
| 26,000 | 77,53,330 | 25,78,160 | 12,05,068 |
| 27,000 | 54,93,475 | 20,47,240 | 3,34,350 |
| Top CALL Open Interest addition: | |||
| Strike | OI | OI Change | Volume |
| 26,000 | 77,53,330 | 25,78,160 | 12,05,068 |
| 25,300 | 41,57,530 | 20,48,020 | 28,81,604 |
| Top CALL Open Interest reduction: | |||
| Strike | OI | OI Change | Volume |
| 25,100 | 10,58,850 | -4,79,895 | 2,29,802 |
| 25,200 | 22,96,645 | -4,16,585 | 10,82,966 |
| Top CALL Volume: | |||
| Strike | OI | OI Change | Volume |
| 25,300 | 41,57,530 | 20,48,020 | 28,81,604 |
| 25,500 | 52,20,150 | 15,54,540 | 16,78,447 |
| Top PUT Open Interest: | |||
| Strike | OI | OI Change | Volume |
| 23,300 | 55,02,510 | 24,84,170 | 3,22,191 |
| 25,000 | 54,39,525 | 12,36,690 | 14,55,695 |
| Top PUT Open Interest addition: | |||
| Strike | OI | OI Change | Volume |
| 25,300 | 39,17,615 | 26,71,045 | 30,79,061 |
| 23,300 | 55,02,510 | 24,84,170 | 3,22,191 |
| Top PUT Open Interest reduction: | |||
| Strike | OI | OI Change | Volume |
| 26,200 | 1,19,405 | -390 | 976 |
| 26,300 | 1,35,915 | -195 | 582 |
| Top PUT Volume: | |||
| Strike | OI | OI Change | Volume |
| 25,300 | 39,17,615 | 26,71,045 | 30,79,061 |
| 25,200 | 30,31,795 | 9,29,565 | 21,19,229 |
NIFTY Monthly Expiry (24/02/2026)
The NIFTY index closed at 25342.75. The NIFTY monthly expiry for FEBRUARY 24, 2026 has revealed key trends in open interest. The current Put/Call Ratio is at 1.096 against previous 1.093. The 25000PE option holds the maximum open interest, followed by the 26000CE and 25500CE options. Market participants have shown increased interest with significant open interest additions in the 24500PE option, with open interest additions also seen in the 26000CE and 25400CE options. On the other hand, open interest reductions were prominent in the 25900CE, 25000PE, and 25100CE options. Trading volume was highest in the 26000CE option, followed by the 25000PE and 25500CE options, indicating active trading in these strikes.
| NIFTY | Monthly | Expiry: | 24-02-2026 |
| Index Spot | PCR OI | Prev PCR OI | PCR VOL |
| 25,342.75 | 1.096 | 1.093 | 0.971 |
| Total Open Interest Change in all CALLs & PUTs: | |||
| Current | Prior | Net Ch | |
| CALL: | 3,54,06,605 | 3,23,75,330 | 30,31,275 |
| PUT: | 3,88,08,640 | 3,53,94,060 | 34,14,580 |
| Top CALL Open Interest: | |||
| Strike | OI | OI Change | Volume |
| 26,000 | 41,61,950 | 5,12,265 | 93,523 |
| 25,500 | 33,50,295 | 4,11,515 | 69,738 |
| Top CALL Open Interest addition: | |||
| Strike | OI | OI Change | Volume |
| 26,000 | 41,61,950 | 5,12,265 | 93,523 |
| 25,400 | 13,75,335 | 4,80,870 | 42,042 |
| Top CALL Open Interest reduction: | |||
| Strike | OI | OI Change | Volume |
| 25,900 | 6,47,855 | -91,715 | 13,799 |
| 25,100 | 3,59,125 | -40,950 | 6,559 |
| Top CALL Volume: | |||
| Strike | OI | OI Change | Volume |
| 26,000 | 41,61,950 | 5,12,265 | 93,523 |
| 25,500 | 33,50,295 | 4,11,515 | 69,738 |
| Top PUT Open Interest: | |||
| Strike | OI | OI Change | Volume |
| 25,000 | 42,27,990 | -80,015 | 72,479 |
| 25,500 | 31,87,990 | 1,79,010 | 64,332 |
| Top PUT Open Interest addition: | |||
| Strike | OI | OI Change | Volume |
| 24,500 | 25,10,950 | 5,70,440 | 59,073 |
| 25,400 | 16,41,835 | 3,35,985 | 43,798 |
| Top PUT Open Interest reduction: | |||
| Strike | OI | OI Change | Volume |
| 25,000 | 42,27,990 | -80,015 | 72,479 |
| 25,700 | 6,56,370 | -24,050 | 4,556 |
| Top PUT Volume: | |||
| Strike | OI | OI Change | Volume |
| 25,000 | 42,27,990 | -80,015 | 72,479 |
| 25,300 | 18,40,540 | 2,80,930 | 64,623 |
BANKNIFTY Monthly Expiry (24/02/2026)
The BANKNIFTY index closed at 59598.8. The BANKNIFTY monthly expiry for FEBRUARY 24, 2026 has revealed key trends in open interest. The current Put/Call Ratio is at 1.098 against previous 1.073. The 60000CE option holds the maximum open interest, followed by the 60000PE and 58000PE options. Market participants have shown increased interest with significant open interest additions in the 59000PE option, with open interest additions also seen in the 59500PE and 59500CE options. On the other hand, open interest reductions were prominent in the 59100CE, 59000CE, and 59300CE options. Trading volume was highest in the 59500PE option, followed by the 60000CE and 59500CE options, indicating active trading in these strikes.
| BANKNIFTY | Monthly | Expiry: | 24-02-2026 |
| Index Spot | PCR OI | Prev PCR OI | PCR VOL |
| 59,598.80 | 1.098 | 1.073 | 0.937 |
| Total Open Interest Change in all CALLs & PUTs: | |||
| Current | Prior | Net Ch | |
| CALL: | 73,55,130 | 58,75,320 | 14,79,810 |
| PUT: | 80,72,370 | 63,05,370 | 17,67,000 |
| Top CALL Open Interest: | |||
| Strike | OI | OI Change | Volume |
| 60,000 | 16,52,160 | 45,120 | 1,03,251 |
| 62,000 | 4,59,420 | 98,520 | 38,137 |
| Top CALL Open Interest addition: | |||
| Strike | OI | OI Change | Volume |
| 59,500 | 3,24,630 | 1,10,400 | 93,420 |
| 64,000 | 2,34,540 | 1,05,360 | 21,217 |
| Top CALL Open Interest reduction: | |||
| Strike | OI | OI Change | Volume |
| 59,100 | 46,410 | -28,020 | 5,079 |
| 59,000 | 2,93,700 | -13,290 | 18,588 |
| Top CALL Volume: | |||
| Strike | OI | OI Change | Volume |
| 60,000 | 16,52,160 | 45,120 | 1,03,251 |
| 59,500 | 3,24,630 | 1,10,400 | 93,420 |
| Top PUT Open Interest: | |||
| Strike | OI | OI Change | Volume |
| 60,000 | 14,39,610 | 89,670 | 40,994 |
| 58,000 | 7,39,530 | 1,09,800 | 46,129 |
| Top PUT Open Interest addition: | |||
| Strike | OI | OI Change | Volume |
| 59,000 | 5,98,350 | 1,56,300 | 65,596 |
| 59,500 | 3,90,870 | 1,52,310 | 1,25,529 |
| Top PUT Open Interest reduction: | |||
| Strike | OI | OI Change | Volume |
| 65,000 | 62,280 | -2,430 | 376 |
| 51,500 | 68,340 | -1,590 | 4,055 |
| Top PUT Volume: | |||
| Strike | OI | OI Change | Volume |
| 59,500 | 3,90,870 | 1,52,310 | 1,25,529 |
| 59,000 | 5,98,350 | 1,56,300 | 65,596 |
MIDCPNIFTY Monthly Expiry (24/02/2026)
The MIDCPNIFTY index closed at 13381.9. The MIDCPNIFTY monthly expiry for FEBRUARY 24, 2026, 2025 has revealed key trends in open interest. The current Put/Call Ratio is at 1.137 against previous 1.064. The 13000PE option holds the maximum open interest, followed by the 12500PE and 14000CE options. Market participants have shown increased interest with significant open interest additions in the 12500PE option, with open interest additions also seen in the 14500CE and 13200PE options. On the other hand, open interest reductions were prominent in the 77000CE, 77000CE, and 77000CE options. Trading volume was highest in the 14000CE option, followed by the 13500CE and 13200PE options, indicating active trading in these strikes.
| MIDCPNIFTY | Monthly | Expiry: | 24-02-2026 |
| Index Spot | PCR OI | Prev PCR OI | PCR VOL |
| 13,381.90 | 1.137 | 1.064 | 0.858 |
| Total Open Interest Change in all CALLs & PUTs: | |||
| Current | Prior | Net Ch | |
| CALL: | 35,51,760 | 19,02,480 | 16,49,280 |
| PUT: | 40,38,600 | 20,24,640 | 20,13,960 |
| Top CALL Open Interest: | |||
| Strike | OI | OI Change | Volume |
| 14,000 | 4,48,080 | 1,53,600 | 16,372 |
| 14,500 | 3,70,200 | 2,26,320 | 5,650 |
| Top CALL Open Interest addition: | |||
| Strike | OI | OI Change | Volume |
| 14,500 | 3,70,200 | 2,26,320 | 5,650 |
| 13,300 | 2,73,240 | 1,63,440 | 11,926 |
| Top CALL Open Interest reduction: | |||
| Strike | OI | OI Change | Volume |
| 12,500 | 11,160 | -1,440 | 74 |
| 13,025 | 4,320 | -1,320 | 67 |
| Top CALL Volume: | |||
| Strike | OI | OI Change | Volume |
| 14,000 | 4,48,080 | 1,53,600 | 16,372 |
| 13,500 | 3,42,480 | 1,60,920 | 15,925 |
| Top PUT Open Interest: | |||
| Strike | OI | OI Change | Volume |
| 13,000 | 7,07,760 | 66,840 | 10,212 |
| 12,500 | 6,23,040 | 3,65,400 | 10,965 |
| Top PUT Open Interest addition: | |||
| Strike | OI | OI Change | Volume |
| 12,500 | 6,23,040 | 3,65,400 | 10,965 |
| 13,200 | 2,71,320 | 2,01,480 | 12,999 |
| Top PUT Open Interest reduction: | |||
| Strike | OI | OI Change | Volume |
| 14,000 | 73,320 | -5,760 | 409 |
| 13,025 | 4,560 | -2,160 | 184 |
| Top PUT Volume: | |||
| Strike | OI | OI Change | Volume |
| 13,200 | 2,71,320 | 2,01,480 | 12,999 |
| 12,500 | 6,23,040 | 3,65,400 | 10,965 |
Conclusion: What the NSE & BSE Indices Futures and Options Open Interest Volume Analysis Tells Us
The combined futures data across indices confirms that the trend is positive, but momentum is selective, making Open Interest Volume Analysis the best tool for decision-making rather than pure price action.
For NIFTY, as long as 25300 holds, dips are likely to be bought, but a clean move above 25600–26000 will require fresh volume expansion — otherwise, expect time correction.
BANKNIFTY traders should watch 60000 closely: acceptance above it can trigger short covering towards 60500–61000, while rejection may pull the index back to 59000 where fresh puts are building.
MIDCPNIFTY remains the strongest structure, and any intraday dip backed by stable OI can be used for long setups, especially in high-beta stocks.
SENSEX short covering with rising volume confirms panic shorts are getting unwound, but low premium warns against aggressive longs at the open.
In summary, Open Interest Volume Analysis clearly shows accumulation, not distribution, and traders should stay with the trend but trade light, trail profits, and avoid chasing breakouts until volume confirms.
Check Previous Day’s NSE & BSE Indices F&O Analysis
FII / FPI trading activity in Capital Market Segment
NSE Derivatives Raw Data
BSE Derivatives Raw Data
Disclaimer
fnodata.com is a financial blog providing research-based data and analysis. The content creator of the fnodata.com is not a SEBI registered Investment Advisor. The content on this blog is for informational purposes only and should not be considered as investment advice. You are responsible for your own investment decisions. You should consult with a financial advisor or conduct your own research before making any investment decisions.