Turning Complex Derivative Data into Clear Market Insights

NSE & BSE Indices Futures and Options Open Interest Volume Analysis for 2/02/2026
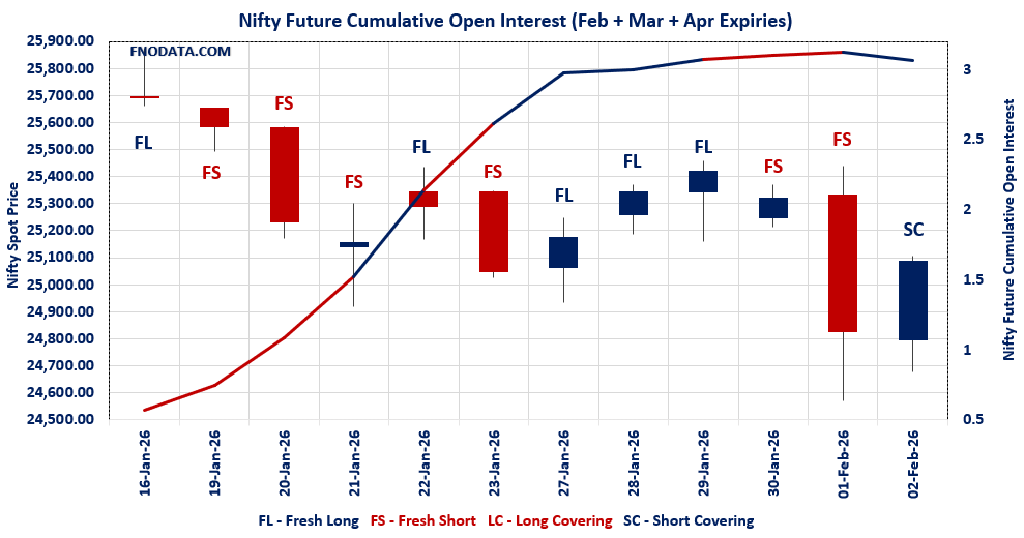
Table of Contents
Markets opened February on a strong note, with NIFTY, BANKNIFTY, MIDCPNIFTY, and SENSEX all closing firmly in the green, but the real story lies beneath the price action — in the Open Interest Volume Analysis.
Across frontline indices, price rise accompanied by sharp decline in futures open interest and volume clearly signals short covering rather than aggressive fresh long creation, especially in NIFTY, MIDCPNIFTY, and SENSEX.
NIFTY’s combined futures OI fell by 6.44% with volumes down 36%, while the index gained over 1% — a textbook bear trap unwind, where pessimistic positions were forced to exit.
The jump in weekly PCR from 0.428 to 0.931 further confirms that panic puts were aggressively added earlier and are now getting neutralized, shifting sentiment from extreme fear to cautious stability.
In contrast, BANKNIFTY stood out as the only index showing genuine strength, with double-digit OI addition despite falling volumes, suggesting selective institutional long build-up, not just short covering.
This divergence makes today’s Open Interest Volume Analysis extremely critical, as it hints that the market is relief-driven but still not in a broad-based trending phase.
For traders, this is a market where data matters more than direction, and derivatives positioning will decide sustainability of the rally, not spot momentum alone.
NSE & BSE F&O Market Signals
NIFTY Future analysis
NIFTY Spot closed at: 25088.4 (1.059%)
Combined = February + March + April
Combined Fut Open Interest Change: -6.44%
Combined Fut Volume Change: -36.01%
Combined Fut Open Interest Analysis: Short Covering
Rollover: 8% Previous 7%
NIFTY FEBRUARY Future closed at: 25141.8 (1.160%)
February Fut Premium 53.4 (Increased by 25.35 points)
February Fut Open Interest Change: -7.21%
February Fut Volume Change: -36.08%
February Fut Open Interest Analysis: Short Covering
NIFTY March Future closed at: 25297.4 (1.070%)
March Fut Premium 209 (Increased by 4.85 points)
March Fut Open Interest Change: -0.05%
March Fut Volume Change: -38.98%
March Fut Open Interest Analysis: Short Covering
NIFTY Weekly Expiry (3/02/2026) Option Analysis
Put-Call Ratio (Open Interest): 0.931 (Increased from 0.428)
Put-Call Ratio (Volume): 0.843
Max Pain Level: 25050
Maximum CALL Open Interest: 26000
Maximum PUT Open Interest: 24000
Highest CALL Addition: 25200
Highest PUT Addition: 24800
NIFTY Monthly Expiry (24/02/2026) Option Analysis
Put-Call Ratio (Open Interest): 1.067 (Increased from 1.048)
Put-Call Ratio (Volume): 0.877
Max Pain Level: 25450
Maximum CALL Open Interest: 25500
Maximum PUT Open Interest: 25000
Highest CALL Addition: 25500
Highest PUT Addition: 24500
BANKNIFTY Future Analysis
BANKNIFTY Spot closed at: 58619 (0.345%)
Combined = February + March + April
Combined Fut Open Interest Change: 12.99%
Combined Fut Volume Change: -30.81%
Combined Fut Open Interest Analysis: Fresh Long
Rollover: 9% Previous 9%
BANKNIFTY FEBRUARY Future closed at: 58842.8 (0.241%)
February Fut Premium 223.8 (Decreased by -60.4 points)
February Fut Open Interest Change: 13.2%
February Fut Volume Change: -32.6%
February Fut Open Interest Analysis: Fresh Long
BANKNIFTY MARCH Future closed at: 59199.2 (0.210%)
March Fut Premium 580.2 (Decreased by -77.8 points)
March Fut Open Interest Change: 7.33%
March Fut Volume Change: 0.24%
March Fut Open Interest Analysis: Fresh Long
BANKNIFTY Monthly Expiry (24/02/2026) Option Analysis
Put-Call Ratio (Open Interest): 0.834 (Decreased from 0.855)
Put-Call Ratio (Volume): 0.919
Max Pain Level: 59400
Maximum CALL Open Interest: 60000
Maximum PUT Open Interest: 60000
Highest CALL Addition: 58500
Highest PUT Addition: 58000
MIDCPNIFTY Future Analysis
MIDCPNIFTY Spot closed at: 13257.05 (1.819%)
Combined = February + March + April
Combined Fut Open Interest Change: -1.38%
Combined Fut Volume Change: -34.31%
Combined Fut Open Interest Analysis: Short Covering
Rollover: 3% Previous 3%
MIDCPNIFTY FEBRUARY Future closed at: 13275.9 (1.922%)
February Fut Premium 18.85 (Increased by 13.6 points)
February Fut Open Interest Change: -1.35%
February Fut Volume Change: -33.94%
February Fut Open Interest Analysis: Short Covering
MIDCPNIFTY MARCH Future closed at: 13329.55 (2.026%)
March Fut Premium 72.5 (Increased by 27.85 points)
March Fut Open Interest Change: -6.34%
March Fut Volume Change: -41.38%
March Fut Open Interest Analysis: Short Covering
MIDCPNIFTY Monthly Expiry (24/02/2026) Option Analysis
Put-Call Ratio (Open Interest): 1.259 (Decreased from 1.270)
Put-Call Ratio (Volume): 0.830
Max Pain Level: 13275
Maximum CALL Open Interest: 14500
Maximum PUT Open Interest: 13000
Highest CALL Addition: 13100
Highest PUT Addition: 13000
SENSEX Monthly Expiry (26/02/2026) Future
SENSEX Spot closed at: 81,666.46 (1.169%)
SENSEX Monthly Future closed at: 82,070.35 (1.016%)
Premium: 403.89 (Decreased by -118.22 points)
Open Interest Change: -7.45%
Volume Change: -42.63%
Open Interest Analysis: Short Covering
SENSEX Weekly Expiry (5/02/2026) Option Analysis
Put-Call Ratio (OI): 0.935 (Increased from 0.467)
Put-Call Ratio (Volume): 0.869
Max Pain Level: 81600
Maximum CALL OI: 85000
Maximum PUT OI: 77000
Highest CALL Addition: 84500
Highest PUT Addition: 81000
FII & DII Cash Market Activity
FIIs Net SELL: ₹ 1,832.46 Cr.
DIIs Net BUY: ₹ 2,446.33 Cr.
FII Derivatives Activity
| FII Trading Stats | 2.02.26 | 1.02.26 | 30.01.26 |
| FII Cash (Provisional Data) | -1,832.46 | -588.34 | 2,251.37 |
| Index Future Open Interest Long Ratio | 11.67% | 11.71% | 12.10% |
| Index Future Volume Long Ratio | 53.71% | 41.38% | 41.58% |
| Call Option Open Interest Long Ratio | 44.11% | 42.96% | 45.42% |
| Call Option Volume Long Ratio | 50.19% | 49.53% | 50.16% |
| Put Option Open Interest Long Ratio | 63.07% | 65.74% | 65.35% |
| Put Option Volume Long Ratio | 49.89% | 50.25% | 50.39% |
| Stock Future Open Interest Long Ratio | 60.51% | 60.42% | 60.69% |
| Stock Future Volume Long Ratio | 50.80% | 45.87% | 45.67% |
| Index Futures | Short Covering | Fresh Short | Fresh Short |
| Index Options | Fresh Long | Fresh Short | Fresh Long |
| Nifty Futures | Short Covering | Fresh Short | Fresh Short |
| Nifty Options | Short Covering | Fresh Short | Fresh Long |
| BankNifty Futures | Fresh Short | Long Covering | Fresh Long |
| BankNifty Options | Fresh Long | Fresh Short | Fresh Long |
| FinNifty Futures | Fresh Short | Fresh Long | Short Covering |
| FinNifty Options | Fresh Short | Fresh Short | Fresh Short |
| MidcpNifty Futures | Fresh Long | Fresh Long | Short Covering |
| MidcpNifty Options | Fresh Long | Short Covering | Fresh Long |
| NiftyNxt50 Futures | Long Covering | Short Covering | Fresh Short |
| NiftyNxt50 Options | Fresh Long | Fresh Short | Fresh Short |
| Stock Futures | Fresh Long | Long Covering | Long Covering |
| Stock Options | Fresh Short | Fresh Long | Fresh Short |
NSE & BSE Option market Trends : Options Insights
SENSEX Weekly Expiry (5/02/2026)
The SENSEX index closed at 81666.46. The SENSEX weekly expiry for FEBRUARY 5, 2026 has revealed key trends in open interest. The current Put/Call Ratio is at 0.935 against previous 0.467. The 85000CE option holds the maximum open interest, followed by the 86000CE and 77000PE options. Market participants have shown increased interest with significant open interest additions in the 81000PE option, with open interest additions also seen in the 77000PE and 80000PE options. On the other hand, open interest reductions were prominent in the 87000CE, 82500CE, and 90000CE options. Trading volume was highest in the 81000PE option, followed by the 80000PE and 81000CE options, indicating active trading in these strikes.
| SENSEX | Weekly | Expiry: | 05-02-2026 |
| Index Spot | PCR OI | Prev PCR OI | PCR VOL |
| 81666.46 | 0.935 | 0.467 | 0.869 |
| Total Open Interest Change in all CALLs & PUTs: | |||
| Current | Prior | Net Ch | |
| CALL: | 1,53,66,780 | 1,70,16,400 | -16,49,620 |
| PUT: | 1,43,62,720 | 79,44,880 | 64,17,840 |
| Top CALL Open Interest: | |||
| Strike | OI | OI Change | Volume |
| 85000 | 9,90,020 | -1,16,780 | 72,31,260 |
| 86000 | 8,77,760 | 3,580 | 47,39,160 |
| Top CALL Open Interest addition: | |||
| Strike | OI | OI Change | Volume |
| 84500 | 6,04,420 | 1,36,500 | 60,87,000 |
| 83700 | 2,43,180 | 74,840 | 29,50,420 |
| Top CALL Open Interest reduction: | |||
| Strike | OI | OI Change | Volume |
| 87000 | 4,90,280 | -2,83,400 | 34,24,300 |
| 82500 | 5,72,500 | -1,85,560 | 1,28,89,880 |
| Top CALL Volume: | |||
| Strike | OI | OI Change | Volume |
| 81000 | 2,84,180 | 11,600 | 1,95,60,120 |
| 82000 | 5,10,960 | -75,880 | 1,91,07,540 |
| Top PUT Open Interest: | |||
| Strike | OI | OI Change | Volume |
| 77000 | 8,69,180 | 4,08,340 | 59,93,040 |
| 80000 | 6,69,400 | 3,13,300 | 2,01,59,820 |
| Top PUT Open Interest addition: | |||
| Strike | OI | OI Change | Volume |
| 81000 | 6,60,860 | 4,41,860 | 2,28,09,280 |
| 77000 | 8,69,180 | 4,08,340 | 59,93,040 |
| Top PUT Open Interest reduction: | |||
| Strike | OI | OI Change | Volume |
| 82200 | 71,400 | -59,340 | 2,34,300 |
| 75100 | 18,040 | -36,960 | 4,68,740 |
| Top PUT Volume: | |||
| Strike | OI | OI Change | Volume |
| 81000 | 6,60,860 | 4,41,860 | 2,28,09,280 |
| 80000 | 6,69,400 | 3,13,300 | 2,01,59,820 |
NIFTY Weekly Expiry (3/02/2026)
The NIFTY index closed at 25088.4. The NIFTY weekly expiry for FEBRUARY 3, 2026 has revealed key trends in open interest. The current Put/Call Ratio is at 0.931 against previous 0.428. The 26000CE option holds the maximum open interest, followed by the 25500CE and 24000PE options. Market participants have shown increased interest with significant open interest additions in the 24800PE option, with open interest additions also seen in the 24500PE and 24900PE options. On the other hand, open interest reductions were prominent in the 26500CE, 27000CE, and 26100CE options. Trading volume was highest in the 25000CE option, followed by the 24800PE and 24900CE options, indicating active trading in these strikes.
| NIFTY | Weekly | Expiry: | 03-02-2026 |
| Index Spot | PCR OI | Prev PCR OI | PCR VOL |
| 25,088.40 | 0.931 | 0.428 | 0.843 |
| Total Open Interest Change in all CALLs & PUTs: | |||
| Current | Prior | Net Ch | |
| CALL: | 20,87,53,090 | 28,30,81,630 | -7,43,28,540 |
| PUT: | 19,42,88,445 | 12,11,57,335 | 7,31,31,110 |
| Top CALL Open Interest: | |||
| Strike | OI | OI Change | Volume |
| 26,000 | 1,90,78,475 | -23,09,125 | 26,38,939 |
| 25,500 | 1,65,20,140 | 3,53,470 | 45,83,445 |
| Top CALL Open Interest addition: | |||
| Strike | OI | OI Change | Volume |
| 25,200 | 92,95,455 | 16,80,770 | 79,06,243 |
| 25,800 | 84,27,445 | 7,15,585 | 17,58,818 |
| Top CALL Open Interest reduction: | |||
| Strike | OI | OI Change | Volume |
| 26,500 | 85,54,195 | -1,06,00,395 | 12,69,580 |
| 27,000 | 54,35,235 | -88,41,430 | 8,63,152 |
| Top CALL Volume: | |||
| Strike | OI | OI Change | Volume |
| 25,000 | 55,28,380 | -47,99,275 | 1,22,89,394 |
| 24,900 | 19,36,220 | -8,29,985 | 82,23,260 |
| Top PUT Open Interest: | |||
| Strike | OI | OI Change | Volume |
| 24,000 | 1,38,84,000 | 26,73,255 | 37,57,860 |
| 24,500 | 1,34,33,160 | 68,41,445 | 68,02,966 |
| Top PUT Open Interest addition: | |||
| Strike | OI | OI Change | Volume |
| 24,800 | 1,01,56,250 | 68,72,710 | 89,84,228 |
| 24,500 | 1,34,33,160 | 68,41,445 | 68,02,966 |
| Top PUT Open Interest reduction: | |||
| Strike | OI | OI Change | Volume |
| 23,300 | 99,02,880 | -18,45,480 | 9,45,190 |
| 23,500 | 1,07,54,640 | -18,29,035 | 17,99,843 |
| Top PUT Volume: | |||
| Strike | OI | OI Change | Volume |
| 24,800 | 1,01,56,250 | 68,72,710 | 89,84,228 |
| 24,700 | 79,87,980 | 45,64,820 | 71,49,031 |
NIFTY Monthly Expiry (24/02/2026)
The NIFTY index closed at 25088.4. The NIFTY monthly expiry for FEBRUARY 24, 2026 has revealed key trends in open interest. The current Put/Call Ratio is at 1.067 against previous 1.048. The 25500CE option holds the maximum open interest, followed by the 25000PE and 26000CE options. Market participants have shown increased interest with significant open interest additions in the 25500CE option, with open interest additions also seen in the 24500PE and 24800PE options. On the other hand, open interest reductions were prominent in the 25300CE, 26200CE, and 25300PE options. Trading volume was highest in the 25000CE option, followed by the 25000PE and 24500PE options, indicating active trading in these strikes.
| NIFTY | Monthly | Expiry: | 24-02-2026 |
| Index Spot | PCR OI | Prev PCR OI | PCR VOL |
| 25,088.40 | 1.067 | 1.048 | 0.877 |
| Total Open Interest Change in all CALLs & PUTs: | |||
| Current | Prior | Net Ch | |
| CALL: | 4,38,28,330 | 4,37,43,440 | 84,890 |
| PUT: | 4,67,48,845 | 4,58,55,550 | 8,93,295 |
| Top CALL Open Interest: | |||
| Strike | OI | OI Change | Volume |
| 25,500 | 61,50,495 | 7,36,125 | 1,31,428 |
| 26,000 | 47,42,595 | -1,18,885 | 1,21,778 |
| Top CALL Open Interest addition: | |||
| Strike | OI | OI Change | Volume |
| 25,500 | 61,50,495 | 7,36,125 | 1,31,428 |
| 24,500 | 6,73,920 | 1,39,750 | 20,341 |
| Top CALL Open Interest reduction: | |||
| Strike | OI | OI Change | Volume |
| 25,300 | 17,92,115 | -3,61,465 | 62,843 |
| 26,200 | 8,53,840 | -2,60,390 | 30,820 |
| Top CALL Volume: | |||
| Strike | OI | OI Change | Volume |
| 25,000 | 34,67,165 | -35,295 | 1,64,180 |
| 25,500 | 61,50,495 | 7,36,125 | 1,31,428 |
| Top PUT Open Interest: | |||
| Strike | OI | OI Change | Volume |
| 25,000 | 48,96,060 | -1,05,170 | 1,50,843 |
| 24,500 | 38,54,890 | 4,48,695 | 1,50,269 |
| Top PUT Open Interest addition: | |||
| Strike | OI | OI Change | Volume |
| 24,500 | 38,54,890 | 4,48,695 | 1,50,269 |
| 24,800 | 15,85,090 | 2,88,600 | 96,567 |
| Top PUT Open Interest reduction: | |||
| Strike | OI | OI Change | Volume |
| 25,300 | 16,63,935 | -2,27,500 | 15,949 |
| 24,000 | 28,46,090 | -2,25,550 | 1,11,812 |
| Top PUT Volume: | |||
| Strike | OI | OI Change | Volume |
| 25,000 | 48,96,060 | -1,05,170 | 1,50,843 |
| 24,500 | 38,54,890 | 4,48,695 | 1,50,269 |
BANKNIFTY Monthly Expiry (24/02/2026)
The BANKNIFTY index closed at 58619. The BANKNIFTY monthly expiry for FEBRUARY 24, 2026 has revealed key trends in open interest. The current Put/Call Ratio is at 0.834 against previous 0.855. The 60000CE option holds the maximum open interest, followed by the 60000PE and 58000PE options. Market participants have shown increased interest with significant open interest additions in the 58000PE option, with open interest additions also seen in the 58500CE and 58000CE options. On the other hand, open interest reductions were prominent in the 59000PE, 66500CE, and 59500PE options. Trading volume was highest in the 58000PE option, followed by the 60000CE and 59000CE options, indicating active trading in these strikes.
| BANKNIFTY | Monthly | Expiry: | 24-02-2026 |
| Index Spot | PCR OI | Prev PCR OI | PCR VOL |
| 58,619.00 | 0.834 | 0.855 | 0.919 |
| Total Open Interest Change in all CALLs & PUTs: | |||
| Current | Prior | Net Ch | |
| CALL: | 1,19,99,970 | 1,08,13,320 | 11,86,650 |
| PUT: | 1,00,11,330 | 92,42,970 | 7,68,360 |
| Top CALL Open Interest: | |||
| Strike | OI | OI Change | Volume |
| 60,000 | 18,87,450 | 84,570 | 1,33,438 |
| 61,000 | 7,08,840 | 99,390 | 66,565 |
| Top CALL Open Interest addition: | |||
| Strike | OI | OI Change | Volume |
| 58,500 | 3,86,760 | 1,95,570 | 1,00,778 |
| 58,000 | 2,71,440 | 1,61,490 | 49,587 |
| Top CALL Open Interest reduction: | |||
| Strike | OI | OI Change | Volume |
| 66,500 | 66,000 | -46,620 | 8,373 |
| 65,000 | 4,49,460 | -25,950 | 23,404 |
| Top CALL Volume: | |||
| Strike | OI | OI Change | Volume |
| 60,000 | 18,87,450 | 84,570 | 1,33,438 |
| 59,000 | 6,11,010 | 1,40,040 | 1,05,277 |
| Top PUT Open Interest: | |||
| Strike | OI | OI Change | Volume |
| 60,000 | 14,31,060 | -39,060 | 13,218 |
| 58,000 | 8,57,460 | 1,97,610 | 1,44,991 |
| Top PUT Open Interest addition: | |||
| Strike | OI | OI Change | Volume |
| 58,000 | 8,57,460 | 1,97,610 | 1,44,991 |
| 58,200 | 1,01,310 | 58,560 | 73,291 |
| Top PUT Open Interest reduction: | |||
| Strike | OI | OI Change | Volume |
| 59,000 | 5,37,660 | -52,350 | 37,695 |
| 59,500 | 2,97,090 | -43,410 | 10,271 |
| Top PUT Volume: | |||
| Strike | OI | OI Change | Volume |
| 58,000 | 8,57,460 | 1,97,610 | 1,44,991 |
| 58,500 | 6,38,460 | 38,010 | 96,806 |
MIDCPNIFTY Monthly Expiry (24/02/2026)
The MIDCPNIFTY index closed at 13257.05. The MIDCPNIFTY monthly expiry for FEBRUARY 24, 2026, 2025 has revealed key trends in open interest. The current Put/Call Ratio is at 1.259 against previous 1.270. The 13000PE option holds the maximum open interest, followed by the 12500PE and 14500CE options. Market participants have shown increased interest with significant open interest additions in the 13100CE option, with open interest additions also seen in the 13000CE and 13000PE options. On the other hand, open interest reductions were prominent in the 68500CE, 67000PE, and 72700CE options. Trading volume was highest in the 13000PE option, followed by the 14000CE and 13500CE options, indicating active trading in these strikes.
| MIDCPNIFTY | Monthly | Expiry: | 24-02-2026 |
| Index Spot | PCR OI | Prev PCR OI | PCR VOL |
| 13,257.05 | 1.259 | 1.270 | 0.830 |
| Total Open Interest Change in all CALLs & PUTs: | |||
| Current | Prior | Net Ch | |
| CALL: | 56,74,320 | 55,35,840 | 1,38,480 |
| PUT: | 71,46,600 | 70,30,200 | 1,16,400 |
| Top CALL Open Interest: | |||
| Strike | OI | OI Change | Volume |
| 14,500 | 7,03,800 | -33,600 | 4,469 |
| 14,000 | 6,86,520 | 53,760 | 16,389 |
| Top CALL Open Interest addition: | |||
| Strike | OI | OI Change | Volume |
| 13,100 | 1,99,920 | 69,960 | 13,844 |
| 13,000 | 4,48,200 | 69,600 | 12,548 |
| Top CALL Open Interest reduction: | |||
| Strike | OI | OI Change | Volume |
| 13,800 | 1,98,240 | -42,600 | 6,328 |
| 14,500 | 7,03,800 | -33,600 | 4,469 |
| Top CALL Volume: | |||
| Strike | OI | OI Change | Volume |
| 14,000 | 6,86,520 | 53,760 | 16,389 |
| 13,500 | 4,80,360 | -2,520 | 14,113 |
| Top PUT Open Interest: | |||
| Strike | OI | OI Change | Volume |
| 13,000 | 13,82,520 | 55,560 | 21,464 |
| 12,500 | 8,32,560 | -56,400 | 13,907 |
| Top PUT Open Interest addition: | |||
| Strike | OI | OI Change | Volume |
| 13,000 | 13,82,520 | 55,560 | 21,464 |
| 13,100 | 2,91,360 | 54,480 | 11,289 |
| Top PUT Open Interest reduction: | |||
| Strike | OI | OI Change | Volume |
| 12,000 | 6,40,440 | -97,200 | 8,310 |
| 12,500 | 8,32,560 | -56,400 | 13,907 |
| Top PUT Volume: | |||
| Strike | OI | OI Change | Volume |
| 13,000 | 13,82,520 | 55,560 | 21,464 |
| 12,500 | 8,32,560 | -56,400 | 13,907 |
Conclusion: What the NSE & BSE Indices Futures and Options Open Interest Volume Analysis Tells Us
NIFTY, MIDCPNIFTY, and SENSEX rallies are primarily driven by short covering, not by aggressive fresh longs — confirmed by falling futures OI, collapsing volumes, and rising PCRs.
Higher futures premiums with declining OI indicate that smart money is not chasing price, but rather reducing risk exposure, suggesting upside may be gradual and capped.
Weekly options data in NIFTY shows strong CALL resistance building near 25200–26000, while PUT additions around 24800–25000 suggest buyers are defending dips rather than betting on breakout.
BANKNIFTY remains the leadership index, with fresh long formation visible, making it a relative outperformer as long as price sustains above 58500–58000 zone.
MIDCPNIFTY’s high PCR (above 1.25) with short covering warns of overcrowded bullish sentiment, increasing the risk of range-bound or profit-booking moves.
From an Open Interest Volume Analysis perspective, the market is transitioning from fear to neutral, but not yet into conviction-driven bullishness.
Actionable Trade Approach:
Prefer buy-on-dips strategies, not breakout chasing.
Focus on option spreads and hedged longs, especially near Max Pain zones.
Keep strict trailing stops, as short-covering rallies tend to fade quickly without volume support.
Bottom line: This is a position-adjustment rally, not a structural trend reversal — and only fresh long OI with volume expansion will confirm a sustainable up-move.
Check Previous Day’s NSE & BSE Indices F&O Analysis
FII / FPI trading activity in Capital Market Segment
NSE Derivatives Raw Data
BSE Derivatives Raw Data
Disclaimer
fnodata.com is a financial blog providing research-based data and analysis. The content creator of the fnodata.com is not a SEBI registered Investment Advisor. The content on this blog is for informational purposes only and should not be considered as investment advice. You are responsible for your own investment decisions. You should consult with a financial advisor or conduct your own research before making any investment decisions.
[…] Check Previous Day’s NSE & BSE Indices F&O Analysis […]