Turning Complex Derivative Data into Clear Market Insights

NSE & BSE Indices Futures and Options Open Interest Volume Analysis for 9/02/2026
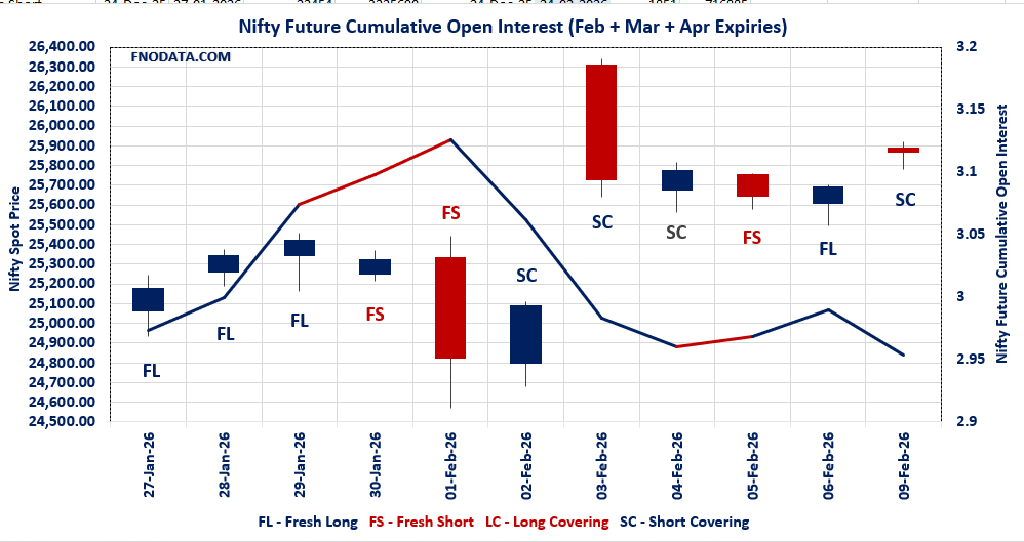
Table of Contents
Today’s Open Interest Volume Analysis clearly signals that the broader Indian derivatives market is transitioning from fear to selective confidence, led by short covering in frontline indices and aggressive fresh longs in banking and midcaps.
NIFTY Futures witnessed classic short covering as prices moved up while Open Interest and volumes contracted across combined expiries, indicating bears exiting rather than aggressive new buying. The rise in futures premium alongside an improving Put-Call Ratio (OI) above 1 reinforces a positive but controlled undertone, suggesting upside continuation with limited panic buying.
BANKNIFTY stands out as the leadership index, where rising prices accompanied by a sharp surge in Open Interest and volumes confirm fresh long build-up, a strong bullish derivative signal. Options data clustering around the 60000 strike reflects a short-term equilibrium zone, but sustained longs indicate dips may continue to attract buyers.
MIDCPNIFTY adds risk-on confirmation, as fresh longs emerged despite lower volumes—often seen during early-stage accumulation. Elevated PCR levels and supportive Max Pain positioning suggest traders are positioning for continuation rather than mean reversion.
SENSEX derivatives echo the NIFTY structure, with visible short covering in futures and balanced weekly options data, pointing to stability rather than over-extension. Overall, this Open Interest Volume Analysis highlights a market where smart money is rotating into strength rather than chasing momentum blindly.
NSE & BSE F&O Market Signals
NIFTY Future analysis
NIFTY Spot closed at: 25867.3 (0.676%)
Combined = February + March + April
Combined Fut Open Interest Change: -3.60%
Combined Fut Volume Change: -22.53%
Combined Fut Open Interest Analysis: Short Covering
Rollover: 10% Previous 9%
NIFTY FEBRUARY Future closed at: 25915.4 (0.701%)
February Fut Premium 48.1 (Increased by 6.7 points)
February Fut Open Interest Change: -4.22%
February Fut Volume Change: -24.63%
February Fut Open Interest Analysis: Short Covering
NIFTY March Future closed at: 26068.8 (0.683%)
March Fut Premium 201.5 (Increased by 3.3 points)
March Fut Open Interest Change: 1.33%
March Fut Volume Change: 2.88%
March Fut Open Interest Analysis: Fresh Long
NIFTY Weekly Expiry (10/02/2026) Option Analysis
Put-Call Ratio (Open Interest): 1.058 (Increased from 0.858)
Put-Call Ratio (Volume): 0.926
Max Pain Level: 25800
Maximum CALL Open Interest: 26000
Maximum PUT Open Interest: 25800
Highest CALL Addition: 26000
Highest PUT Addition: 25800
NIFTY Monthly Expiry (24/02/2026) Option Analysis
Put-Call Ratio (Open Interest): 1.184 (Increased from 1.143)
Put-Call Ratio (Volume): 1.124
Max Pain Level: 25700
Maximum CALL Open Interest: 26000
Maximum PUT Open Interest: 25500
Highest CALL Addition: 26500
Highest PUT Addition: 25500
BANKNIFTY Future Analysis
BANKNIFTY Spot closed at: 60669.35 (0.913%)
Combined = February + March + April
Combined Fut Open Interest Change: 15.37%
Combined Fut Volume Change: 26.20%
Combined Fut Open Interest Analysis: Fresh Long
Rollover: 11% Previous 10%
BANKNIFTY FEBRUARY Future closed at: 60728 (0.789%)
February Fut Premium 58.65 (Decreased by -73.2 points)
February Fut Open Interest Change: 15.2%
February Fut Volume Change: 25.5%
February Fut Open Interest Analysis: Fresh Long
BANKNIFTY MARCH Future closed at: 61068.2 (0.794%)
March Fut Premium 398.85 (Decreased by -68 points)
March Fut Open Interest Change: 15.46%
March Fut Volume Change: 34.18%
March Fut Open Interest Analysis: Fresh Long
BANKNIFTY Monthly Expiry (24/02/2026) Option Analysis
Put-Call Ratio (Open Interest): 1.013 (Increased from 0.912)
Put-Call Ratio (Volume): 0.924
Max Pain Level: 60000
Maximum CALL Open Interest: 60000
Maximum PUT Open Interest: 60000
Highest CALL Addition: 60700
Highest PUT Addition: 60700
MIDCPNIFTY Future Analysis
MIDCPNIFTY Spot closed at: 13868.65 (1.640%)
Combined = February + March + April
Combined Fut Open Interest Change: 2.00%
Combined Fut Volume Change: -17.69%
Combined Fut Open Interest Analysis: Fresh Long
Rollover: 4% Previous 4%
MIDCPNIFTY FEBRUARY Future closed at: 13865.5 (1.536%)
February Fut Discount -3.15 (Decreased by -13.95 points)
February Fut Open Interest Change: 2.04%
February Fut Volume Change: -17.95%
February Fut Open Interest Analysis: Fresh Long
MIDCPNIFTY MARCH Future closed at: 13932.4 (1.499%)
March Fut Discount 63.75 (Decreased by -18 points)
March Fut Open Interest Change: 0.18%
March Fut Volume Change: -13.71%
March Fut Open Interest Analysis: Fresh Long
MIDCPNIFTY Monthly Expiry (24/02/2026) Option Analysis
Put-Call Ratio (Open Interest): 1.193 (Increased from 1.084)
Put-Call Ratio (Volume): 0.861
Max Pain Level: 13700
Maximum CALL Open Interest: 14500
Maximum PUT Open Interest: 13000
Highest CALL Addition: 14500
Highest PUT Addition: 13800
SENSEX Monthly Expiry (26/02/2026) Future
SENSEX Spot closed at: 84,065.75 (0.581%)
SENSEX Monthly Future closed at: 84,291.40 (0.559%)
Premium: 225.65 (Decreased by -16.4 points)
Open Interest Change: -10.13%
Volume Change: -4.70%
Open Interest Analysis: Short Covering
SENSEX Weekly Expiry (12/02/2026) Option Analysis
Put-Call Ratio (OI): 1.052 (Decreased from 1.104)
Put-Call Ratio (Volume): 0.932
Max Pain Level: 84000
Maximum CALL OI: 84000
Maximum PUT OI: 84000
Highest CALL Addition: 84000
Highest PUT Addition: 84000
FII & DII Cash Market Activity
FIIs Net BUY: ₹ 2,254.64 Cr.
DIIs Net BUY: ₹ 4.15 Cr.
FII Derivatives Activity
| FII Trading Stats | 9.02.26 | 6.02.26 | 5.02.26 |
| FII Cash (Provisional Data) | 2,254.64 | 1,950.77 | -2,150.51 |
| Index Future Open Interest Long Ratio | 18.96% | 18.32% | 18.50% |
| Index Future Volume Long Ratio | 58.51% | 39.79% | 54.00% |
| Call Option Open Interest Long Ratio | 50.71% | 48.94% | 47.34% |
| Call Option Volume Long Ratio | 50.31% | 50.20% | 49.96% |
| Put Option Open Interest Long Ratio | 58.31% | 59.57% | 60.46% |
| Put Option Volume Long Ratio | 49.87% | 50.11% | 50.56% |
| Stock Future Open Interest Long Ratio | 60.30% | 60.19% | 60.49% |
| Stock Future Volume Long Ratio | 50.84% | 47.47% | 46.99% |
| Index Futures | Short Covering | Fresh Short | Short Covering |
| Index Options | Fresh Long | Fresh Long | Fresh Long |
| Nifty Futures | Short Covering | Fresh Short | Short Covering |
| Nifty Options | Fresh Long | Fresh Long | Fresh Long |
| BankNifty Futures | Fresh Long | Long Covering | Long Covering |
| BankNifty Options | Fresh Short | Fresh Long | Fresh Short |
| FinNifty Futures | Fresh Long | Short Covering | Long Covering |
| FinNifty Options | Fresh Short | Short Covering | Fresh Short |
| MidcpNifty Futures | Fresh Short | Fresh Short | Short Covering |
| MidcpNifty Options | Fresh Short | Long Covering | Short Covering |
| NiftyNxt50 Futures | Fresh Long | Short Covering | Short Covering |
| NiftyNxt50 Options | Fresh Long | Fresh Long | Fresh Short |
| Stock Futures | Fresh Long | Long Covering | Long Covering |
| Stock Options | Fresh Short | Fresh Short | Fresh Short |
NSE & BSE Option market Trends : Options Insights
SENSEX Weekly Expiry (12/02/2026)
The SENSEX index closed at 84065.75. The SENSEX weekly expiry for FEBRUARY 12, 2026 has revealed key trends in open interest. The current Put/Call Ratio is at 1.052 against previous 1.104. The 84000PE option holds the maximum open interest, followed by the 84000CE and 80000PE options. Market participants have shown increased interest with significant open interest additions in the 84000PE option, with open interest additions also seen in the 84000CE and 80000PE options. On the other hand, open interest reductions were prominent in the 83500CE, 83600CE, and 83500PE options. Trading volume was highest in the 84000PE option, followed by the 84000CE and 84100CE options, indicating active trading in these strikes.
| SENSEX | Weekly | Expiry: | 12-02-2026 |
| Index Spot | PCR OI | Prev PCR OI | PCR VOL |
| 84065.75 | 1.052 | 1.104 | 0.932 |
| Total Open Interest Change in all CALLs & PUTs: | |||
| Current | Prior | Net Ch | |
| CALL: | 1,23,49,280 | 87,78,640 | 35,70,640 |
| PUT: | 1,29,96,520 | 96,88,940 | 33,07,580 |
| Top CALL Open Interest: | |||
| Strike | OI | OI Change | Volume |
| 84000 | 9,35,940 | 5,15,060 | 2,82,01,780 |
| 88000 | 9,01,800 | 3,02,120 | 35,46,260 |
| Top CALL Open Interest addition: | |||
| Strike | OI | OI Change | Volume |
| 84000 | 9,35,940 | 5,15,060 | 2,82,01,780 |
| 88000 | 9,01,800 | 3,02,120 | 35,46,260 |
| Top CALL Open Interest reduction: | |||
| Strike | OI | OI Change | Volume |
| 83500 | 3,38,420 | -3,87,520 | 27,33,000 |
| 83600 | 61,920 | -1,39,500 | 13,30,040 |
| Top CALL Volume: | |||
| Strike | OI | OI Change | Volume |
| 84000 | 9,35,940 | 5,15,060 | 2,82,01,780 |
| 84100 | 3,95,100 | 2,77,200 | 1,69,40,120 |
| Top PUT Open Interest: | |||
| Strike | OI | OI Change | Volume |
| 84000 | 9,68,320 | 8,10,160 | 2,83,31,720 |
| 80000 | 9,11,040 | 4,31,460 | 47,39,140 |
| Top PUT Open Interest addition: | |||
| Strike | OI | OI Change | Volume |
| 84000 | 9,68,320 | 8,10,160 | 2,83,31,720 |
| 80000 | 9,11,040 | 4,31,460 | 47,39,140 |
| Top PUT Open Interest reduction: | |||
| Strike | OI | OI Change | Volume |
| 83500 | 6,16,020 | -1,06,120 | 1,00,35,500 |
| 81100 | 44,380 | -64,540 | 6,67,720 |
| Top PUT Volume: | |||
| Strike | OI | OI Change | Volume |
| 84000 | 9,68,320 | 8,10,160 | 2,83,31,720 |
| 83900 | 2,70,380 | 2,38,460 | 1,35,15,000 |
NIFTY Weekly Expiry (10/02/2026)
The NIFTY index closed at 25867.3. The NIFTY weekly expiry for FEBRUARY 10, 2026 has revealed key trends in open interest. The current Put/Call Ratio is at 1.058 against previous 0.858. The 26000CE option holds the maximum open interest, followed by the 27000CE and 25800PE options. Market participants have shown increased interest with significant open interest additions in the 25800PE option, with open interest additions also seen in the 25850PE and 25750PE options. On the other hand, open interest reductions were prominent in the 25700CE, 25600CE, and 25750CE options. Trading volume was highest in the 25800PE option, followed by the 25900CE and 25850CE options, indicating active trading in these strikes.
| NIFTY | Weekly | Expiry: | 10-02-2026 |
| Index Spot | PCR OI | Prev PCR OI | PCR VOL |
| 25,867.30 | 1.058 | 0.858 | 0.926 |
| Total Open Interest Change in all CALLs & PUTs: | |||
| Current | Prior | Net Ch | |
| CALL: | 19,11,45,305 | 19,57,21,760 | -45,76,455 |
| PUT: | 20,22,75,125 | 16,79,30,555 | 3,43,44,570 |
| Top CALL Open Interest: | |||
| Strike | OI | OI Change | Volume |
| 26,000 | 1,91,86,700 | 47,25,695 | 68,19,274 |
| 27,000 | 1,53,32,785 | -31,21,365 | 11,32,662 |
| Top CALL Open Interest addition: | |||
| Strike | OI | OI Change | Volume |
| 26,000 | 1,91,86,700 | 47,25,695 | 68,19,274 |
| 25,900 | 1,14,86,020 | 47,13,410 | 84,65,196 |
| Top CALL Open Interest reduction: | |||
| Strike | OI | OI Change | Volume |
| 25,700 | 28,26,915 | -67,35,170 | 17,78,793 |
| 25,600 | 13,97,825 | -40,41,180 | 4,35,625 |
| Top CALL Volume: | |||
| Strike | OI | OI Change | Volume |
| 25,900 | 1,14,86,020 | 47,13,410 | 84,65,196 |
| 25,850 | 74,34,700 | 35,39,380 | 79,58,440 |
| Top PUT Open Interest: | |||
| Strike | OI | OI Change | Volume |
| 25,800 | 1,38,69,960 | 1,04,72,215 | 95,40,533 |
| 25,000 | 1,15,03,050 | 13,44,330 | 15,32,023 |
| Top PUT Open Interest addition: | |||
| Strike | OI | OI Change | Volume |
| 25,800 | 1,38,69,960 | 1,04,72,215 | 95,40,533 |
| 25,850 | 74,06,425 | 68,82,850 | 65,59,600 |
| Top PUT Open Interest reduction: | |||
| Strike | OI | OI Change | Volume |
| 23,500 | 35,65,250 | -20,95,275 | 3,14,817 |
| 25,100 | 30,68,520 | -19,26,860 | 8,65,752 |
| Top PUT Volume: | |||
| Strike | OI | OI Change | Volume |
| 25,800 | 1,38,69,960 | 1,04,72,215 | 95,40,533 |
| 25,850 | 74,06,425 | 68,82,850 | 65,59,600 |
NIFTY Monthly Expiry (24/02/2026)
The NIFTY index closed at 25867.3. The NIFTY monthly expiry for FEBRUARY 24, 2026 has revealed key trends in open interest. The current Put/Call Ratio is at 1.184 against previous 1.143. The 25500PE option holds the maximum open interest, followed by the 26000CE and 25000PE options. Market participants have shown increased interest with significant open interest additions in the 26500CE option, with open interest additions also seen in the 25500PE and 26100CE options. On the other hand, open interest reductions were prominent in the 25700CE, 26000CE, and 25000PE options. Trading volume was highest in the 26000CE option, followed by the 25500PE and 26500CE options, indicating active trading in these strikes.
| NIFTY | Monthly | Expiry: | 24-02-2026 |
| Index Spot | PCR OI | Prev PCR OI | PCR VOL |
| 25,867.30 | 1.184 | 1.143 | 1.124 |
| Total Open Interest Change in all CALLs & PUTs: | |||
| Current | Prior | Net Ch | |
| CALL: | 4,42,08,320 | 4,37,95,570 | 4,12,750 |
| PUT: | 5,23,57,955 | 5,00,59,035 | 22,98,920 |
| Top CALL Open Interest: | |||
| Strike | OI | OI Change | Volume |
| 26,000 | 53,88,045 | -5,83,830 | 1,41,615 |
| 26,500 | 45,36,350 | 9,30,605 | 95,857 |
| Top CALL Open Interest addition: | |||
| Strike | OI | OI Change | Volume |
| 26,500 | 45,36,350 | 9,30,605 | 95,857 |
| 26,100 | 11,11,695 | 4,17,235 | 34,878 |
| Top CALL Open Interest reduction: | |||
| Strike | OI | OI Change | Volume |
| 25,700 | 10,95,640 | -6,16,720 | 40,825 |
| 26,000 | 53,88,045 | -5,83,830 | 1,41,615 |
| Top CALL Volume: | |||
| Strike | OI | OI Change | Volume |
| 26,000 | 53,88,045 | -5,83,830 | 1,41,615 |
| 26,500 | 45,36,350 | 9,30,605 | 95,857 |
| Top PUT Open Interest: | |||
| Strike | OI | OI Change | Volume |
| 25,500 | 57,85,130 | 7,07,590 | 98,729 |
| 25,000 | 45,52,080 | -3,01,730 | 94,807 |
| Top PUT Open Interest addition: | |||
| Strike | OI | OI Change | Volume |
| 25,500 | 57,85,130 | 7,07,590 | 98,729 |
| 25,350 | 5,63,745 | 4,01,635 | 13,940 |
| Top PUT Open Interest reduction: | |||
| Strike | OI | OI Change | Volume |
| 25,000 | 45,52,080 | -3,01,730 | 94,807 |
| 25,300 | 15,58,960 | -2,53,890 | 31,104 |
| Top PUT Volume: | |||
| Strike | OI | OI Change | Volume |
| 25,500 | 57,85,130 | 7,07,590 | 98,729 |
| 25,000 | 45,52,080 | -3,01,730 | 94,807 |
BANKNIFTY Monthly Expiry (24/02/2026)
The BANKNIFTY index closed at 60669.35. The BANKNIFTY monthly expiry for FEBRUARY 24, 2026 has revealed key trends in open interest. The current Put/Call Ratio is at 1.013 against previous 0.912. The 60000PE option holds the maximum open interest, followed by the 60000CE and 58000PE options. Market participants have shown increased interest with significant open interest additions in the 60700PE option, with open interest additions also seen in the 60700CE and 60500PE options. On the other hand, open interest reductions were prominent in the 60000CE, 60200CE, and 60100CE options. Trading volume was highest in the 60500CE option, followed by the 61000CE and 60600PE options, indicating active trading in these strikes.
| BANKNIFTY | Monthly | Expiry: | 24-02-2026 |
| Index Spot | PCR OI | Prev PCR OI | PCR VOL |
| 60,669.35 | 1.013 | 0.912 | 0.924 |
| Total Open Interest Change in all CALLs & PUTs: | |||
| Current | Prior | Net Ch | |
| CALL: | 1,26,96,390 | 1,27,33,920 | -37,530 |
| PUT: | 1,28,56,170 | 1,16,11,470 | 12,44,700 |
| Top CALL Open Interest: | |||
| Strike | OI | OI Change | Volume |
| 60,000 | 15,29,820 | -1,44,060 | 51,739 |
| 61,000 | 6,95,700 | -3,510 | 1,07,959 |
| Top CALL Open Interest addition: | |||
| Strike | OI | OI Change | Volume |
| 60,700 | 3,85,860 | 2,76,540 | 91,253 |
| 60,600 | 2,28,720 | 1,14,570 | 97,138 |
| Top CALL Open Interest reduction: | |||
| Strike | OI | OI Change | Volume |
| 60,000 | 15,29,820 | -1,44,060 | 51,739 |
| 60,200 | 1,81,080 | -1,28,220 | 16,641 |
| Top CALL Volume: | |||
| Strike | OI | OI Change | Volume |
| 60,500 | 6,48,600 | 35,220 | 1,09,247 |
| 61,000 | 6,95,700 | -3,510 | 1,07,959 |
| Top PUT Open Interest: | |||
| Strike | OI | OI Change | Volume |
| 60,000 | 19,84,710 | 49,470 | 97,066 |
| 58,000 | 8,93,340 | 54,030 | 35,200 |
| Top PUT Open Interest addition: | |||
| Strike | OI | OI Change | Volume |
| 60,700 | 3,25,860 | 2,86,200 | 89,391 |
| 60,500 | 5,30,880 | 2,40,060 | 85,711 |
| Top PUT Open Interest reduction: | |||
| Strike | OI | OI Change | Volume |
| 55,000 | 3,23,250 | -29,550 | 14,340 |
| 57,800 | 60,450 | -27,240 | 3,497 |
| Top PUT Volume: | |||
| Strike | OI | OI Change | Volume |
| 60,600 | 1,90,140 | 1,35,180 | 99,398 |
| 60,000 | 19,84,710 | 49,470 | 97,066 |
MIDCPNIFTY Monthly Expiry (24/02/2026)
The MIDCPNIFTY index closed at 13868.65. The MIDCPNIFTY monthly expiry for FEBRUARY 24, 2026, 2025 has revealed key trends in open interest. The current Put/Call Ratio is at 1.193 against previous 1.084. The 14500CE option holds the maximum open interest, followed by the 13000PE and 14000CE options. Market participants have shown increased interest with significant open interest additions in the 13800PE option, with open interest additions also seen in the 14500CE and 13400PE options. On the other hand, open interest reductions were prominent in the 67500CE, 67000CE, and 69100PE options. Trading volume was highest in the 14000CE option, followed by the 14100CE and 13800CE options, indicating active trading in these strikes.
| MIDCPNIFTY | Monthly | Expiry: | 24-02-2026 |
| Index Spot | PCR OI | Prev PCR OI | PCR VOL |
| 13,868.65 | 1.193 | 1.084 | 0.861 |
| Total Open Interest Change in all CALLs & PUTs: | |||
| Current | Prior | Net Ch | |
| CALL: | 64,15,200 | 63,61,560 | 53,640 |
| PUT: | 76,55,520 | 68,98,680 | 7,56,840 |
| Top CALL Open Interest: | |||
| Strike | OI | OI Change | Volume |
| 14,500 | 11,28,360 | 2,14,320 | 11,247 |
| 14,000 | 5,94,600 | -1,92,960 | 23,397 |
| Top CALL Open Interest addition: | |||
| Strike | OI | OI Change | Volume |
| 14,500 | 11,28,360 | 2,14,320 | 11,247 |
| 13,850 | 1,60,920 | 1,34,400 | 8,678 |
| Top CALL Open Interest reduction: | |||
| Strike | OI | OI Change | Volume |
| 14,000 | 5,94,600 | -1,92,960 | 23,397 |
| 13,700 | 2,16,720 | -1,66,200 | 7,911 |
| Top CALL Volume: | |||
| Strike | OI | OI Change | Volume |
| 14,000 | 5,94,600 | -1,92,960 | 23,397 |
| 14,100 | 2,31,600 | 76,560 | 22,249 |
| Top PUT Open Interest: | |||
| Strike | OI | OI Change | Volume |
| 13,000 | 10,35,000 | -1,080 | 12,332 |
| 12,000 | 5,45,520 | -34,800 | 3,298 |
| Top PUT Open Interest addition: | |||
| Strike | OI | OI Change | Volume |
| 13,800 | 4,01,760 | 3,21,120 | 15,090 |
| 13,400 | 4,51,800 | 1,73,520 | 10,147 |
| Top PUT Open Interest reduction: | |||
| Strike | OI | OI Change | Volume |
| 12,500 | 5,36,520 | -1,08,720 | 5,611 |
| 13,300 | 2,68,440 | -66,120 | 8,071 |
| Top PUT Volume: | |||
| Strike | OI | OI Change | Volume |
| 13,800 | 4,01,760 | 3,21,120 | 15,090 |
| 13,000 | 10,35,000 | -1,080 | 12,332 |
Conclusion: What the NSE & BSE Indices Futures and Options Open Interest Volume Analysis Tells Us
The Open Interest Volume Analysis for 9th February 2026 confirms that the market is structurally bullish but not euphoric, a healthy setup for positional traders. Short covering in NIFTY and SENSEX reduces downside risk, while fresh longs in BANKNIFTY and MIDCPNIFTY provide directional leadership.
From an options perspective, PCR readings above 1 across most indices signal comfort on the downside, with Max Pain levels acting as strong intraday reference zones rather than hard reversal points. This indicates range expansion is more likely than sharp reversals.
Actionable Strategy:
Prefer buy-on-dips in NIFTY above the 25800 zone with strict risk management.
Stay bullish-biased on BANKNIFTY, especially on intraday pullbacks, as long as Open Interest continues to expand with price.
MIDCAP traders should trail positions tightly, as rising OI with falling volume suggests accumulation but demands patience.
In summary, this Open Interest Volume Analysis suggests traders should align with the trend, respect key OI levels, and avoid aggressive counter-trend trades until fresh shorts emerge with price rejection. The derivative data currently favors discipline, not aggression.
Check Previous Day’s NSE & BSE Indices F&O Analysis
FII / FPI trading activity in Capital Market Segment
NSE Derivatives Raw Data
BSE Derivatives Raw Data
Disclaimer
fnodata.com is a financial blog providing research-based data and analysis. The content creator of the fnodata.com is not a SEBI registered Investment Advisor. The content on this blog is for informational purposes only and should not be considered as investment advice. You are responsible for your own investment decisions. You should consult with a financial advisor or conduct your own research before making any investment decisions.
[…] Check Previous Day’s NSE & BSE Indices F&O Analysis […]