Turning Complex Derivative Data into Clear Market Insights

NSE & BSE Indices Futures and Options Open Interest Volume Analysis for 25/02/2026
Table of Contents
Open Interest Volume Analysis for 25/02/2026 clearly signals a market in transition rather than conviction. Across NIFTY, MIDCPNIFTY, and SENSEX, we are seeing price upticks accompanied by declining futures open interest and volumes, which is a textbook indication of short covering, not fresh bullish aggression.
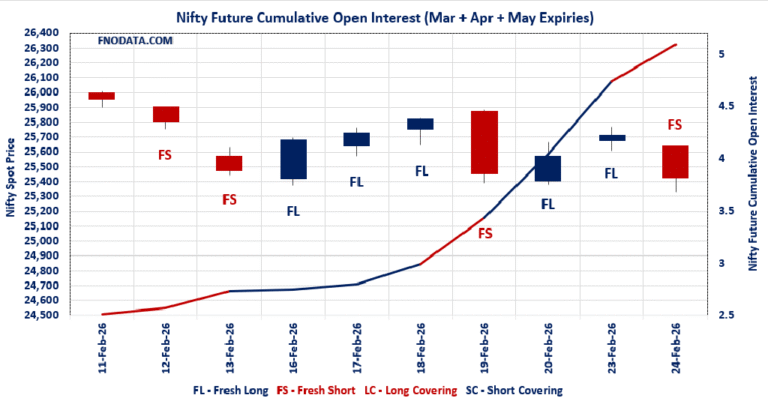
In NIFTY, the combined futures OI fell by 2.6% with a sharp 20.6% drop in volume, confirming that today’s upside was largely driven by unwinding of short positions, not fresh longs. The fall in futures premium across March and April further supports the view that traders are reluctant to carry aggressive bullish bets forward.
Options data reinforces the cautious tone. Weekly PCR remains sub-1 at 0.654, with maximum CALL OI at 25600 acting as an immediate supply zone, while Max Pain at 25500 suggests tight range-bound activity. Monthly PCR above 1 looks supportive on paper, but the heavy CALL writing at higher strikes (26000–26500) indicates that smart money is still betting against a runaway rally.
BANKNIFTY stands out as a clear weak link in today’s Open Interest Volume Analysis. Despite flat prices, combined futures OI rose by 8.31% while volumes fell, a classic sign of fresh short build-up. When price stagnates and OI rises, it usually hints that downside risk is being positioned quietly.
Overall, the derivatives data suggests that markets are being pushed higher by position adjustments, not by confidence, making risk management and cautious positioning essential at current levels.
NSE & BSE F&O Market Signals
NIFTY Future analysis
NIFTY Spot closed at: 25482.5 (0.228%)
Combined = March + April + May
Combined Fut Open Interest Change: -2.60%
Combined Fut Volume Change: -20.61%
Combined Fut Open Interest Analysis: Short Covering
Rollover: 7% Previous 6%
NIFTY March Future closed at: 25628.8 (0.111%)
March Fut Premium 146.3 (Decreased by -29.35 points)
March Fut Open Interest Change: -3.22%
March Fut Volume Change: -21.44%
March Fut Open Interest Analysis: Short Covering
NIFTY April Future closed at: 25791.8 (0.089%)
April Fut Premium 309.3 (Decreased by -34.85 points)
April Fut Open Interest Change: 1.63%
April Fut Volume Change: -30.08%
April Fut Open Interest Analysis: Fresh Long
NIFTY Weekly Expiry (3/02/2026) Option Analysis
Put-Call Ratio (Open Interest): 0.654 (Increased from 0.601)
Put-Call Ratio (Volume): 1.000
Max Pain Level: 25500
Maximum CALL Open Interest: 25600
Maximum PUT Open Interest: 25500
Highest CALL Addition: 25600
Highest PUT Addition: 23100
NIFTY Monthly Expiry (30/03/2026) Option Analysis
Put-Call Ratio (Open Interest): 1.309 (Decreased from 1.309)
Put-Call Ratio (Volume): 1.049
Max Pain Level: 25800
Maximum CALL Open Interest: 26000
Maximum PUT Open Interest: 25000
Highest CALL Addition: 26500
Highest PUT Addition: 25000
BANKNIFTY Future Analysis
BANKNIFTY Spot closed at: 61043.35 (-0.006%)
Combined = March + April + May
Combined Fut Open Interest Change: 8.31%
Combined Fut Volume Change: -26.77%
Combined Fut Open Interest Analysis: Fresh Short
Rollover: 11% Previous 7%
BANKNIFTY MARCH Future closed at: 61367.8 (-0.116%)
March Fut Premium 324.45 (Decreased by -67.45 points)
March Fut Open Interest Change: 3.5%
March Fut Volume Change: -32.7%
March Fut Open Interest Analysis: Fresh Short
BANKNIFTY APRIL Future closed at: 61715 (-0.114%)
April Fut Premium 671.65 (Decreased by -66.25 points)
April Fut Open Interest Change: 36.79%
April Fut Volume Change: 18.33%
April Fut Open Interest Analysis: Fresh Short
BANKNIFTY Monthly Expiry (30/03/2026) Option Analysis
Put-Call Ratio (Open Interest): 1.081 (Decreased from 1.199)
Put-Call Ratio (Volume): 1.108
Max Pain Level: 61000
Maximum CALL Open Interest: 61000
Maximum PUT Open Interest: 61000
Highest CALL Addition: 61600
Highest PUT Addition: 60000
MIDCPNIFTY Future Analysis
MIDCPNIFTY Spot closed at: 13558.55 (0.817%)
Combined = March + April + May
Combined Fut Open Interest Change: -1.11%
Combined Fut Volume Change: -33.62%
Combined Fut Open Interest Analysis: Short Covering
Rollover: 2% Previous 2%
MIDCPNIFTY MARCH Future closed at: 13625.15 (0.879%)
March Fut Premium 66.6 (Increased by 8.8 points)
March Fut Open Interest Change: -1.23%
March Fut Volume Change: -34.97%
March Fut Open Interest Analysis: Short Covering
MIDCPNIFTY APRIL Future closed at: 13688.55 (0.734%)
April Fut Premium 130 (Decreased by -10.1 points)
April Fut Open Interest Change: 2.23%
April Fut Volume Change: 2.37%
April Fut Open Interest Analysis: Fresh Long
MIDCPNIFTY Monthly Expiry (30/03/2026) Option Analysis
Put-Call Ratio (Open Interest): 1.144 (Increased from 1.114)
Put-Call Ratio (Volume): 0.973
Max Pain Level: 13500
Maximum CALL Open Interest: 14700
Maximum PUT Open Interest: 13000
Highest CALL Addition: 14700
Highest PUT Addition: 13000
SENSEX Monthly Expiry (26/02/2026) Future
SENSEX Spot closed at: 82,276.07 (0.061%)
SENSEX Monthly Future closed at: 82,321.75 (-0.017%)
Premium: 45.68 (Decreased by -64.3 points)
Open Interest Change: -17.56%
Volume Change: 49.68%
Open Interest Analysis: Long Covering
SENSEX Weekly Expiry (26/02/2026) Option Analysis
Put-Call Ratio (OI): 0.626 (Increased from 0.581)
Put-Call Ratio (Volume): 1.125
Max Pain Level: 82500
Maximum CALL OI: 83000
Maximum PUT OI: 79000
Highest CALL Addition: 83000
Highest PUT Addition: 81500
FII & DII Cash Market Activity
FIIs Net BUY: ₹ 2,991.64 Cr.
DIIs Net BUY: ₹ 5,118.57 Cr.
FII Derivatives Activity
| FII Trading Stats | 25.02.26 | 24.02.26 | 23.02.26 |
| FII Cash (Provisional Data) | 2,991.64 | -102.53 | 3,483.70 |
| Index Future Open Interest Long Ratio | 21.05% | 21.28% | 29.20% |
| Index Future Volume Long Ratio | 52.77% | 40.76% | 51.29% |
| Call Option Open Interest Long Ratio | 46.15% | 45.89% | 51.67% |
| Call Option Volume Long Ratio | 49.93% | 49.81% | 49.96% |
| Put Option Open Interest Long Ratio | 64.25% | 68.03% | 59.63% |
| Put Option Volume Long Ratio | 49.88% | 49.92% | 50.10% |
| Stock Future Open Interest Long Ratio | 59.45% | 59.40% | 59.51% |
| Stock Future Volume Long Ratio | 51.21% | 50.16% | 50.59% |
| Index Futures | Short Covering | Long Covering | Fresh Long |
| Index Options | Fresh Short | Long Covering | Fresh Long |
| Nifty Futures | Short Covering | Long Covering | Fresh Long |
| Nifty Options | Fresh Short | Long Covering | Fresh Long |
| BankNifty Futures | Short Covering | Long Covering | Fresh Short |
| BankNifty Options | Fresh Short | Long Covering | Fresh Short |
| FinNifty Futures | Fresh Short | Short Covering | Long Covering |
| FinNifty Options | Fresh Short | Long Covering | Short Covering |
| MidcpNifty Futures | Short Covering | Short Covering | Fresh Long |
| MidcpNifty Options | Fresh Long | Long Covering | Fresh Short |
| NiftyNxt50 Futures | Fresh Long | Fresh Short | Fresh Long |
| NiftyNxt50 Options | Fresh Long | Short Covering | Fresh Long |
| Stock Futures | Fresh Long | Short Covering | Fresh Long |
| Stock Options | Fresh Long | Long Covering | Long Covering |
Fresh Long: Net Buy with Increase in Open Interest
Fresh Short: Net Sell with Increase in Open Interest
Short Covering: Net Buy with Decrease in Open Interest
Long Covering: Net Sell with Decrease in Open Interest
NSE & BSE Option market Trends : Options Insights
SENSEX weekly Expiry (26/02/2026)
The SENSEX index closed at 82276.07. The SENSEX weekly expiry for FEBRUARY 26, 2026 has revealed key trends in open interest. The current Put/Call Ratio is at 0.626 against previous 0.581. The 83000CE option holds the maximum open interest, followed by the 85000CE and 84500CE options. Market participants have shown increased interest with significant open interest additions in the 83000CE option, with open interest additions also seen in the 85000CE and 81500PE options. On the other hand, open interest reductions were prominent in the 84800CE, 88000CE, and 90000CE options. Trading volume was highest in the 82000PE option, followed by the 83000CE and 82800CE options, indicating active trading in these strikes.
| SENSEX | Weekly | Expiry: | 26-02-2026 |
| Index Spot | PCR OI | Prev PCR OI | PCR VOL |
| 82276.07 | 0.626 | 0.581 | 1.125 |
| Total Open Interest Change in all CALLs & PUTs: | |||
| Current | Prior | Net Ch | |
| CALL: | 4,85,15,560 | 2,74,65,800 | 2,10,49,760 |
| PUT: | 3,03,63,120 | 1,59,63,720 | 1,43,99,400 |
| Top CALL Open Interest: | |||
| Strike | OI | OI Change | Volume |
| 83000 | 33,03,440 | 17,62,400 | 12,90,84,700 |
| 85000 | 28,92,680 | 13,94,380 | 2,66,18,340 |
| Top CALL Open Interest addition: | |||
| Strike | OI | OI Change | Volume |
| 83000 | 33,03,440 | 17,62,400 | 12,90,84,700 |
| 85000 | 28,92,680 | 13,94,380 | 2,66,18,340 |
| Top CALL Open Interest reduction: | |||
| Strike | OI | OI Change | Volume |
| 84800 | 5,02,400 | -1,32,160 | 62,50,580 |
| 88000 | 7,30,040 | -1,13,220 | 40,01,060 |
| Top CALL Volume: | |||
| Strike | OI | OI Change | Volume |
| 83000 | 33,03,440 | 17,62,400 | 12,90,84,700 |
| 82800 | 15,15,420 | 9,31,800 | 10,25,86,520 |
| Top PUT Open Interest: | |||
| Strike | OI | OI Change | Volume |
| 79000 | 18,85,940 | 5,48,800 | 2,00,85,180 |
| 80000 | 18,84,720 | 5,90,160 | 2,55,61,740 |
| Top PUT Open Interest addition: | |||
| Strike | OI | OI Change | Volume |
| 81500 | 16,89,500 | 11,93,020 | 8,29,27,380 |
| 79500 | 13,74,560 | 8,64,720 | 1,53,05,240 |
| Top PUT Open Interest reduction: | |||
| Strike | OI | OI Change | Volume |
| 82600 | 2,26,180 | -25,040 | 5,88,69,320 |
| 83400 | 18,240 | -23,620 | 8,83,020 |
| Top PUT Volume: | |||
| Strike | OI | OI Change | Volume |
| 82000 | 13,22,720 | 6,31,920 | 13,64,07,500 |
| 82200 | 8,89,960 | 4,64,300 | 10,25,64,820 |
NIFTY Weekly Expiry (2/03/2026)
The NIFTY index closed at 25482.5. The NIFTY weekly expiry for MARCH 2, 2026 has revealed key trends in open interest. The current Put/Call Ratio is at 0.654 against previous 0.601. The 25600CE option holds the maximum open interest, followed by the 25700CE and 26000CE options. Market participants have shown increased interest with significant open interest additions in the 25600CE option, with open interest additions also seen in the 25700CE and 25650CE options. On the other hand, open interest reductions were prominent in the 25400CE, 27200CE, and 25900PE options. Trading volume was highest in the 25500PE option, followed by the 25600CE and 25600PE options, indicating active trading in these strikes.
| NIFTY | Weekly | Expiry: | 02-03-2026 |
| Index Spot | PCR OI | Prev PCR OI | PCR VOL |
| 25,482.50 | 0.654 | 0.601 | 1.000 |
| Total Open Interest Change in all CALLs & PUTs: | |||
| Current | Prior | Net Ch | |
| CALL: | 13,34,89,265 | 8,50,63,030 | 4,84,26,235 |
| PUT: | 8,72,85,705 | 5,11,32,965 | 3,61,52,740 |
| Top CALL Open Interest: | |||
| Strike | OI | OI Change | Volume |
| 25,600 | 84,11,130 | 41,70,010 | 41,02,521 |
| 25,700 | 82,68,715 | 36,00,155 | 29,54,383 |
| Top CALL Open Interest addition: | |||
| Strike | OI | OI Change | Volume |
| 25,600 | 84,11,130 | 41,70,010 | 41,02,521 |
| 25,700 | 82,68,715 | 36,00,155 | 29,54,383 |
| Top CALL Open Interest reduction: | |||
| Strike | OI | OI Change | Volume |
| 25,400 | 19,84,905 | -5,56,985 | 8,79,541 |
| 27,200 | 17,90,100 | -2,40,370 | 1,22,660 |
| Top CALL Volume: | |||
| Strike | OI | OI Change | Volume |
| 25,600 | 84,11,130 | 41,70,010 | 41,02,521 |
| 25,500 | 73,44,155 | 5,30,660 | 30,08,963 |
| Top PUT Open Interest: | |||
| Strike | OI | OI Change | Volume |
| 25,500 | 60,34,535 | 19,98,165 | 43,49,589 |
| 23,100 | 59,89,815 | 26,00,975 | 2,54,729 |
| Top PUT Open Interest addition: | |||
| Strike | OI | OI Change | Volume |
| 23,100 | 59,89,815 | 26,00,975 | 2,54,729 |
| 25,500 | 60,34,535 | 19,98,165 | 43,49,589 |
| Top PUT Open Interest reduction: | |||
| Strike | OI | OI Change | Volume |
| 25,900 | 3,83,240 | -59,800 | 76,337 |
| 26,100 | 3,11,480 | -50,050 | 7,323 |
| Top PUT Volume: | |||
| Strike | OI | OI Change | Volume |
| 25,500 | 60,34,535 | 19,98,165 | 43,49,589 |
| 25,600 | 28,10,340 | 13,74,685 | 35,06,726 |
NIFTY Monthly Expiry (30/03/2026)
The NIFTY index closed at 25482.5. The NIFTY monthly expiry for MARCH 30, 2026 has revealed key trends in open interest. The current Put/Call Ratio is at 1.309 against previous 1.309. The 25000PE option holds the maximum open interest, followed by the 26000CE and 26000PE options. Market participants have shown increased interest with significant open interest additions in the 26500CE option, with open interest additions also seen in the 25000PE and 25800CE options. On the other hand, open interest reductions were prominent in the 26000CE, 25500CE, and 26000PE options. Trading volume was highest in the 25500PE option, followed by the 26000CE and 25000PE options, indicating active trading in these strikes.
| NIFTY | Monthly | Expiry: | 30-03-2026 |
| Index Spot | PCR OI | Prev PCR OI | PCR VOL |
| 25,482.50 | 1.309 | 1.309 | 1.049 |
| Total Open Interest Change in all CALLs & PUTs: | |||
| Current | Prior | Net Ch | |
| CALL: | 4,07,04,920 | 3,88,05,350 | 18,99,570 |
| PUT: | 5,32,85,020 | 5,08,04,395 | 24,80,625 |
| Top CALL Open Interest: | |||
| Strike | OI | OI Change | Volume |
| 26,000 | 56,43,830 | -2,48,750 | 83,423 |
| 27,000 | 40,64,750 | 67,385 | 35,429 |
| Top CALL Open Interest addition: | |||
| Strike | OI | OI Change | Volume |
| 26,500 | 34,75,355 | 4,08,590 | 68,935 |
| 25,800 | 15,55,645 | 3,01,470 | 35,089 |
| Top CALL Open Interest reduction: | |||
| Strike | OI | OI Change | Volume |
| 26,000 | 56,43,830 | -2,48,750 | 83,423 |
| 25,500 | 24,62,200 | -80,795 | 60,313 |
| Top CALL Volume: | |||
| Strike | OI | OI Change | Volume |
| 26,000 | 56,43,830 | -2,48,750 | 83,423 |
| 26,500 | 34,75,355 | 4,08,590 | 68,935 |
| Top PUT Open Interest: | |||
| Strike | OI | OI Change | Volume |
| 25,000 | 64,34,940 | 3,99,155 | 74,418 |
| 26,000 | 47,18,695 | -71,990 | 28,790 |
| Top PUT Open Interest addition: | |||
| Strike | OI | OI Change | Volume |
| 25,000 | 64,34,940 | 3,99,155 | 74,418 |
| 25,500 | 37,32,495 | 2,80,020 | 1,05,462 |
| Top PUT Open Interest reduction: | |||
| Strike | OI | OI Change | Volume |
| 26,000 | 47,18,695 | -71,990 | 28,790 |
| 23,000 | 26,53,335 | -43,515 | 14,077 |
| Top PUT Volume: | |||
| Strike | OI | OI Change | Volume |
| 25,500 | 37,32,495 | 2,80,020 | 1,05,462 |
| 25,000 | 64,34,940 | 3,99,155 | 74,418 |
BANKNIFTY Monthly Expiry (24/02/2026)
The BANKNIFTY index closed at 61043.35. The BANKNIFTY monthly expiry for MARCH 30, 2026 has revealed key trends in open interest. The current Put/Call Ratio is at 1.081 against previous 1.199. The 61000PE option holds the maximum open interest, followed by the 61000CE and 60000PE options. Market participants have shown increased interest with significant open interest additions in the 60000PE option, with open interest additions also seen in the 61600CE and 61200CE options. On the other hand, open interest reductions were prominent in the 61100PE, 56600PE, and 56100PE options. Trading volume was highest in the 61000PE option, followed by the 61000CE and 61200PE options, indicating active trading in these strikes.
| BANKNIFTY | Monthly | Expiry: | 30-03-2026 |
| Index Spot | PCR OI | Prev PCR OI | PCR VOL |
| 61,043.35 | 1.081 | 1.199 | 1.108 |
| Total Open Interest Change in all CALLs & PUTs: | |||
| Current | Prior | Net Ch | |
| CALL: | 85,57,130 | 64,99,810 | 20,57,320 |
| PUT: | 92,47,170 | 77,92,890 | 14,54,280 |
| Top CALL Open Interest: | |||
| Strike | OI | OI Change | Volume |
| 61,000 | 13,89,480 | 34,020 | 87,039 |
| 61,500 | 5,27,715 | 93,775 | 75,232 |
| Top CALL Open Interest addition: | |||
| Strike | OI | OI Change | Volume |
| 61,600 | 1,80,840 | 1,33,980 | 27,179 |
| 61,200 | 2,52,900 | 1,33,290 | 60,724 |
| Top CALL Open Interest reduction: | |||
| Strike | OI | OI Change | Volume |
| 57,000 | 48,700 | -270 | 44 |
| 58,500 | 52,910 | -210 | 70 |
| Top CALL Volume: | |||
| Strike | OI | OI Change | Volume |
| 61,000 | 13,89,480 | 34,020 | 87,039 |
| 61,500 | 5,27,715 | 93,775 | 75,232 |
| Top PUT Open Interest: | |||
| Strike | OI | OI Change | Volume |
| 61,000 | 15,97,290 | 72,750 | 1,38,195 |
| 60,000 | 10,23,790 | 1,42,625 | 65,246 |
| Top PUT Open Interest addition: | |||
| Strike | OI | OI Change | Volume |
| 60,000 | 10,23,790 | 1,42,625 | 65,246 |
| 60,600 | 1,34,460 | 87,840 | 16,754 |
| Top PUT Open Interest reduction: | |||
| Strike | OI | OI Change | Volume |
| 61,100 | 1,17,420 | -5,040 | 47,299 |
| 56,600 | 1,770 | -2,340 | 511 |
| Top PUT Volume: | |||
| Strike | OI | OI Change | Volume |
| 61,000 | 15,97,290 | 72,750 | 1,38,195 |
| 61,200 | 1,48,380 | 47,520 | 80,469 |
MIDCPNIFTY Monthly Expiry (24/02/2026)
The MIDCPNIFTY index closed at 13558.55. The MIDCPNIFTY monthly expiry for MARCH 30, 2026, 2025 has revealed key trends in open interest. The current Put/Call Ratio is at 1.144 against previous 1.114. The 13000PE option holds the maximum open interest, followed by the 12500PE and 14700CE options. Market participants have shown increased interest with significant open interest additions in the 13000PE option, with open interest additions also seen in the 14700CE and 13500PE options. On the other hand, open interest reductions were prominent in the 80500CE, 80500CE, and 80500CE options. Trading volume was highest in the 14000CE option, followed by the 13500CE and 13500PE options, indicating active trading in these strikes.
| MIDCPNIFTY | Monthly | Expiry: | 30-03-2026 |
| Index Spot | PCR OI | Prev PCR OI | PCR VOL |
| 13,558.55 | 1.144 | 1.114 | 0.973 |
| Total Open Interest Change in all CALLs & PUTs: | |||
| Current | Prior | Net Ch | |
| CALL: | 30,08,160 | 17,79,240 | 12,28,920 |
| PUT: | 34,39,920 | 19,81,560 | 14,58,360 |
| Top CALL Open Interest: | |||
| Strike | OI | OI Change | Volume |
| 14,700 | 4,54,680 | 2,35,680 | 4,723 |
| 13,500 | 3,15,960 | 74,040 | 14,806 |
| Top CALL Open Interest addition: | |||
| Strike | OI | OI Change | Volume |
| 14,700 | 4,54,680 | 2,35,680 | 4,723 |
| 13,600 | 2,05,680 | 1,10,400 | 8,824 |
| Top CALL Open Interest reduction: | |||
| Strike | OI | OI Change | Volume |
| 13,400 | 43,920 | -51,120 | 1,562 |
| 13,000 | 65,040 | -15,240 | 427 |
| Top CALL Volume: | |||
| Strike | OI | OI Change | Volume |
| 14,000 | 2,99,160 | 36,960 | 15,136 |
| 13,500 | 3,15,960 | 74,040 | 14,806 |
| Top PUT Open Interest: | |||
| Strike | OI | OI Change | Volume |
| 13,000 | 6,90,600 | 2,83,800 | 10,855 |
| 12,500 | 4,55,040 | 17,640 | 7,004 |
| Top PUT Open Interest addition: | |||
| Strike | OI | OI Change | Volume |
| 13,000 | 6,90,600 | 2,83,800 | 10,855 |
| 13,500 | 4,34,400 | 1,42,800 | 14,648 |
| Top PUT Open Interest reduction: | |||
| Strike | OI | OI Change | Volume |
| 13,700 | 48,240 | -7,320 | 1,450 |
| 15,000 | 1,440 | -120 | 1 |
| Top PUT Volume: | |||
| Strike | OI | OI Change | Volume |
| 13,500 | 4,34,400 | 1,42,800 | 14,648 |
| 13,000 | 6,90,600 | 2,83,800 | 10,855 |
Conclusion: What the NSE & BSE Indices Futures and Options Open Interest Volume Analysis Tells Us
The Open Interest Volume Analysis for 25/02/2026 strongly argues against complacency. While headline indices show mild green closes, the underlying derivatives structure lacks broad-based strength.
NIFTY and MIDCPNIFTY rallies are fragile, driven mainly by short covering and selective long additions in far-month contracts, which historically tend to fade unless followed by volume expansion. Traders should treat 25500–25600 in NIFTY as a high-risk zone, given heavy CALL concentration.
BANKNIFTY remains the biggest concern, with persistent fresh short build-up across March and April futures. As long as prices remain below 61500–61700, any bounce should be viewed as a selling opportunity rather than a trend reversal.
SENSEX data shows long covering with rising volumes, indicating distribution rather than accumulation—another reason to avoid leveraged overnight longs.
Actionable takeaway:
Prefer intraday or very short-term trades
Avoid aggressive carry-forward positions
Hedge positional longs using options
Respect option-defined resistance and Max Pain levels
Until Open Interest and Volume start expanding together with price, the market remains technically vulnerable, and being cautious is not defensive—it is disciplined.
Check Previous Day’s NSE & BSE Indices F&O Analysis
FII / FPI trading activity in Capital Market Segment
NSE Derivatives Raw Data
BSE Derivatives Raw Data
Disclaimer
fnodata.com is a financial blog providing research-based data and analysis. The content creator of the fnodata.com is not a SEBI registered Investment Advisor. The content on this blog is for informational purposes only and should not be considered as investment advice. You are responsible for your own investment decisions. You should consult with a financial advisor or conduct your own research before making any investment decisions.