Turning Complex Derivative Data into Clear Market Insights

NSE & BSE Indices Futures and Options Open Interest Volume Analysis for 27/02/2026
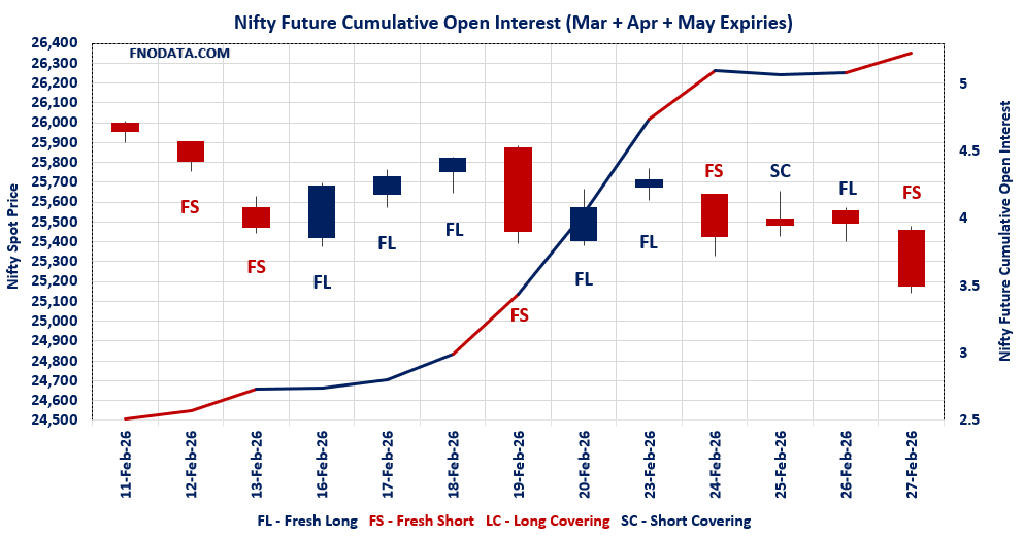
Table of Contents
Today’s Open Interest Volume Analysis across NIFTY, BANKNIFTY, MIDCPNIFTY and SENSEX clearly signals aggressive short build-up in frontline indices, with sharp spikes in futures OI and volumes — especially in April series contracts.
The market decline is not merely price-led; it is derivative-backed selling, confirmed by rising open interest alongside falling prices across major indices.
The data suggests institutional positioning rather than retail panic, particularly visible in April futures where OI expansion is exceptionally high.
Option chain shifts further validate the defensive stance, with weekly PCR collapsing sharply in NIFTY and SENSEX — indicating call-side dominance and near-term pressure.
Overall, this Open Interest Volume Analysis indicates a structurally weak undertone going into the next session, demanding a cautious, hedge-oriented trading approach.
NIFTY Derivative Analysis
Futures Data Interpretation
Spot Down -1.247% with Combined OI +14.53% & Volume +73.43% → Classic Fresh Short Build-Up
March OI +8.82%, April OI +53.37% (massive rollover shift)
April volume exploded +257% → Strong institutional repositioning
Premium increased despite fall → Carry trade positioning; shorts are comfortable
Interpretation:
This is not profit booking.
This is aggressive positional shorting.
Rising rollover (12% vs 7%) confirms traders are carrying forward bearish bets.
Weekly Option Structure (03/02/2026)
PCR (OI) collapsed to 0.456 → Bearish sentiment spike
Max Pain: 25300 (Price below this = downside magnet active)
Heavy Call Addition at 25400 → Immediate resistance
Strongest Put OI at 25000 → Key support
Highest Put Addition at 23100 → Deep tail hedge, not immediate support
Weekly Conclusion:
25400–25500 = Strong Call Wall
25000 = Critical support
Breakdown below 25000 can accelerate toward 24700 zone
Monthly Option Structure (30/03/2026)
PCR still above 1 (1.229) but falling → Medium-term caution
Highest Put Addition at 25300 → Important swing support
Highest Call Addition at 25500 → Strong supply
Max Pain 25750 → Upside recovery capped
Monthly Conclusion:
25300 = Institutional defense zone
Below that → structural weakness confirmation
26000 remains positional resistance
BANKNIFTY Derivative Analysis
Futures Data:
Combined OI +23.41% with price down → Aggressive Fresh Shorts
April OI +94.47% (massive positioning shift)
Volume +497% in April → Very strong institutional entry
Premium widening → Bears confident in carry
Options Structure:
PCR dropped to 0.997 (neutral to slightly bearish)
Max Pain 61000
Maximum Call OI = 61000
Maximum Put OI = 61000 (battle zone)
Highest Put Addition 59300 → Downside hedge level
Interpretation:
61000 = Pivot battlefield
Below 60500 → 59300 possible
No strong bullish structure visible
MIDCPNIFTY Derivative Analysis
Futures:
Combined OI slightly negative (-0.76%) → Long Covering
March long unwinding confirmed
April slight fresh short (+4%)
Premium contraction → Weak demand
Options:
PCR 1.082 (stable)
Max Pain 13600
Highest Call OI 14700 (far resistance)
Highest Put OI 13000 (strong base)
Interpretation:
Relative stability vs large caps
13000 critical support
If breaks, long liquidation may intensify
SENSEX Derivative Analysis
Futures:
OI +36% with price fall → Fresh Shorts
Premium narrowing → Slight hesitation but bearish undertone intact
Weekly Options:
PCR collapsed to 0.543 → Bearish bias
Max Pain 81800
Heavy Call OI at 82500
Strong Put OI at 79000
Highest Put Addition at 81500 → Immediate cushion
Interpretation:
81800 pivot
Below 81000 → downside opens
82500 strong resistance
NSE & BSE F&O Market Signals
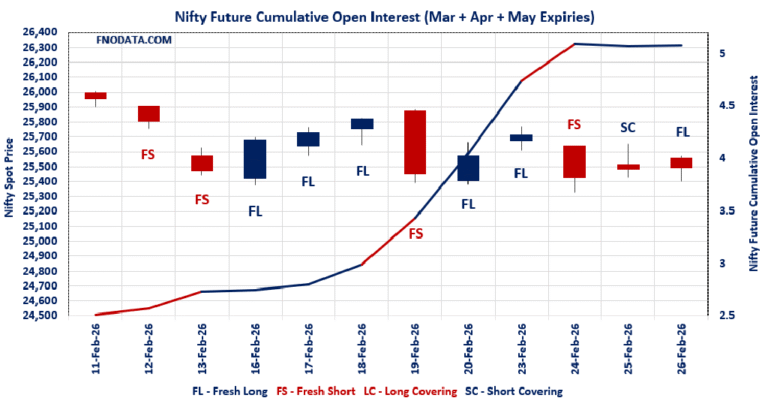
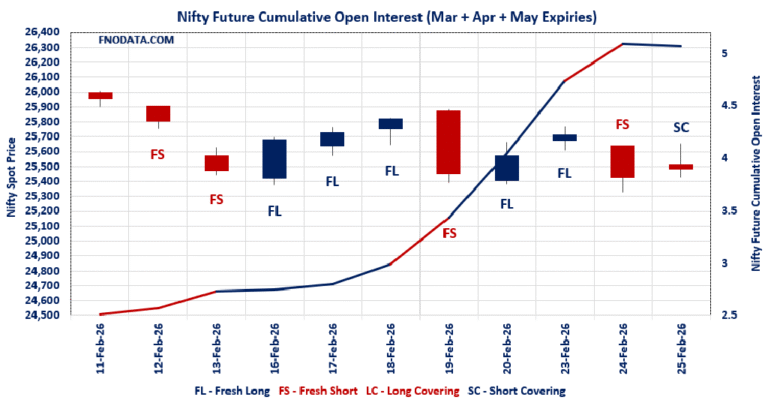
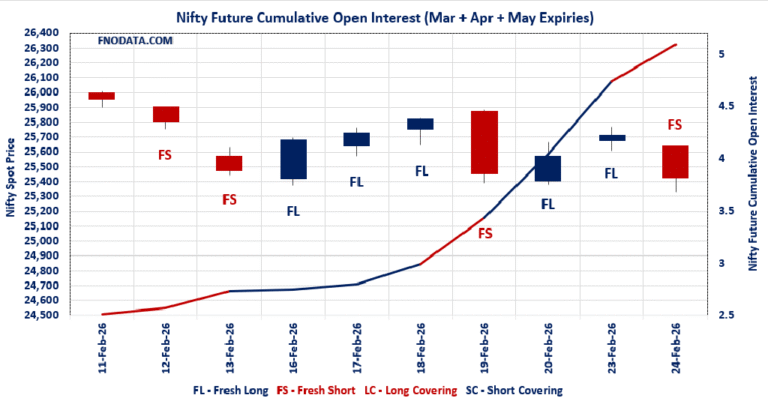
NIFTY Future analysis
NIFTY Spot closed at: 25178.65 (-1.247%)
Combined = March + April + May
Combined Fut Open Interest Change: 14.53%
Combined Fut Volume Change: 73.43%
Combined Fut Open Interest Analysis: Fresh Short
Rollover: 12% Previous 7%
NIFTY March Future closed at: 25338.6 (-1.159%)
March Fut Premium 159.95 (Increased by 20.7 points)
March Fut Open Interest Change: 8.82%
March Fut Volume Change: 53.06%
March Fut Open Interest Analysis: Fresh Short
NIFTY April Future closed at: 25499 (-1.140%)
April Fut Premium 320.35 (Increased by 23.9 points)
April Fut Open Interest Change: 53.37%
April Fut Volume Change: 257.39%
April Fut Open Interest Analysis: Fresh Short
NIFTY Weekly Expiry (3/02/2026) Option Analysis
Put-Call Ratio (Open Interest): 0.456 (Decreased from 0.692)
Put-Call Ratio (Volume): 1.156
Max Pain Level: 25300
Maximum CALL Open Interest: 26000
Maximum PUT Open Interest: 25000
Highest CALL Addition: 25400
Highest PUT Addition: 23100
NIFTY Monthly Expiry (30/03/2026) Option Analysis
Put-Call Ratio (Open Interest): 1.229 (Decreased from 1.295)
Put-Call Ratio (Volume): 0.936
Max Pain Level: 25750
Maximum CALL Open Interest: 26000
Maximum PUT Open Interest: 25000
Highest CALL Addition: 25500
Highest PUT Addition: 25300
BANKNIFTY Future Analysis
BANKNIFTY Spot closed at: 60529 (-1.077%)
Combined = March + April + May
Combined Fut Open Interest Change: 23.41%
Combined Fut Volume Change: 123.62%
Combined Fut Open Interest Analysis: Fresh Short
Rollover: 23% Previous 12%
BANKNIFTY MARCH Future closed at: 60901 (-0.976%)
March Fut Premium 372 (Increased by 58.7 points)
March Fut Open Interest Change: 7.6%
March Fut Volume Change: 78.8%
March Fut Open Interest Analysis: Fresh Short
BANKNIFTY APRIL Future closed at: 61281.6 (-0.896%)
April Fut Premium 752.6 (Increased by 104.7 points)
April Fut Open Interest Change: 94.47%
April Fut Volume Change: 497.02%
April Fut Open Interest Analysis: Fresh Short
BANKNIFTY Monthly Expiry (30/03/2026) Option Analysis
Put-Call Ratio (Open Interest): 0.997 (Decreased from 1.142)
Put-Call Ratio (Volume): 1.315
Max Pain Level: 61000
Maximum CALL Open Interest: 61000
Maximum PUT Open Interest: 61000
Highest CALL Addition: 61000
Highest PUT Addition: 59300
MIDCPNIFTY Future Analysis
MIDCPNIFTY Spot closed at: 13491.45 (-1.183%)
Combined = March + April + May
Combined Fut Open Interest Change: -0.76%
Combined Fut Volume Change: 25.66%
Combined Fut Open Interest Analysis: Long Covering
Rollover: 3% Previous 2%
MIDCPNIFTY MARCH Future closed at: 13529.85 (-1.384%)
March Fut Premium 38.4 (Decreased by -28.4 points)
March Fut Open Interest Change: -0.89%
March Fut Volume Change: 27.57%
March Fut Open Interest Analysis: Long Covering
MIDCPNIFTY APRIL Future closed at: 13599.35 (-1.370%)
April Fut Premium 107.9 (Decreased by -27.35 points)
April Fut Open Interest Change: 4.00%
April Fut Volume Change: -10.10%
April Fut Open Interest Analysis: Fresh Short
MIDCPNIFTY Monthly Expiry (30/03/2026) Option Analysis
Put-Call Ratio (Open Interest): 1.082 (Increased from 1.077)
Put-Call Ratio (Volume): 1.033
Max Pain Level: 13600
Maximum CALL Open Interest: 14700
Maximum PUT Open Interest: 13000
Highest CALL Addition: 14700
Highest PUT Addition: 12000
SENSEX Monthly Expiry (25/03/2026) Future
SENSEX Spot closed at: 81,287.19 (-1.169%)
SENSEX Monthly Future closed at: 81,807.65 (-1.216%)
Premium: 520.46 (Decreased by -45.83 points)
Open Interest Change: 36.06%
Volume Change: -5.27%
Open Interest Analysis: Fresh Short
SENSEX Weekly Expiry (5/03/2026) Option Analysis
Put-Call Ratio (OI): 0.543 (Decreased from 0.841)
Put-Call Ratio (Volume): 1.397
Max Pain Level: 81800
Maximum CALL OI: 82500
Maximum PUT OI: 79000
Highest CALL Addition: 82000
Highest PUT Addition: 81500
FII & DII Cash Market Activity
FIIs Net SELL: ₹ 7,536.36 Cr.
DIIs Net BUY: ₹ 12,292.81 Cr.
FII Derivatives Activity
| FII Trading Stats | 27.02.26 | 26.02.26 | 25.02.26 |
| FII Cash (Provisional Data) | -7,536.36 | -3,465.99 | 2,991.64 |
| Index Future Open Interest Long Ratio | 18.42% | 21.71% | 21.05% |
| Index Future Volume Long Ratio | 23.83% | 53.67% | 52.77% |
| Call Option Open Interest Long Ratio | 47.09% | 45.96% | 46.15% |
| Call Option Volume Long Ratio | 50.01% | 49.86% | 49.93% |
| Put Option Open Interest Long Ratio | 65.65% | 63.07% | 64.25% |
| Put Option Volume Long Ratio | 50.37% | 50.04% | 49.88% |
| Stock Future Open Interest Long Ratio | 59.11% | 59.38% | 59.45% |
| Stock Future Volume Long Ratio | 47.74% | 49.96% | 51.21% |
| Index Futures | Fresh Short | Fresh Long | Short Covering |
| Index Options | Fresh Long | Fresh Short | Fresh Short |
| Nifty Futures | Fresh Short | Fresh Long | Short Covering |
| Nifty Options | Fresh Long | Fresh Short | Fresh Short |
| BankNifty Futures | Long Covering | Long Covering | Short Covering |
| BankNifty Options | Fresh Long | Fresh Long | Fresh Short |
| FinNifty Futures | Long Covering | Short Covering | Fresh Short |
| FinNifty Options | Fresh Short | Fresh Short | Fresh Short |
| MidcpNifty Futures | Long Covering | Fresh Long | Short Covering |
| MidcpNifty Options | Fresh Short | Fresh Long | Fresh Long |
| NiftyNxt50 Futures | Long Covering | Long Covering | Fresh Long |
| NiftyNxt50 Options | Fresh Long | Fresh Long | Fresh Long |
| Stock Futures | Long Covering | Fresh Short | Fresh Long |
| Stock Options | Fresh Short | Fresh Long | Fresh Long |
Fresh Long: Net Buy with Increase in Open Interest
Fresh Short: Net Sell with Increase in Open Interest
Short Covering: Net Buy with Decrease in Open Interest
Long Covering: Net Sell with Decrease in Open Interest
NSE & BSE Option market Trends : Options Insights
SENSEX weekly Expiry (5/03/2026)
The SENSEX index closed at 81287.19. The SENSEX weekly expiry for MARCH 5, 2026 has revealed key trends in open interest. The current Put/Call Ratio is at 0.543 against previous 0.841. The 82500CE option holds the maximum open interest, followed by the 83000CE and 86000CE options. Market participants have shown increased interest with significant open interest additions in the 82000CE option, with open interest additions also seen in the 82500CE and 85000CE options. On the other hand, open interest reductions were prominent in the 82300PE, 82500PE, and 82400PE options. Trading volume was highest in the 81700PE option, followed by the 81800PE and 82000PE options, indicating active trading in these strikes.
| SENSEX | Weekly | Expiry: | 05-03-2026 |
| Index Spot | PCR OI | Prev PCR OI | PCR VOL |
| 81287.19 | 0.543 | 0.841 | 1.397 |
| Total Open Interest Change in all CALLs & PUTs: | |||
| Current | Prior | Net Ch | |
| CALL: | 1,33,37,620 | 47,45,160 | 85,92,460 |
| PUT: | 72,38,900 | 39,89,440 | 32,49,460 |
| Top CALL Open Interest: | |||
| Strike | OI | OI Change | Volume |
| 82500 | 10,71,660 | 6,26,260 | 91,58,980 |
| 83000 | 8,55,440 | 4,36,900 | 61,73,600 |
| Top CALL Open Interest addition: | |||
| Strike | OI | OI Change | Volume |
| 82000 | 7,63,040 | 6,38,180 | 1,51,59,060 |
| 82500 | 10,71,660 | 6,26,260 | 91,58,980 |
| Top CALL Open Interest reduction: | |||
| Strike | OI | OI Change | Volume |
| 89600 | 1,940 | -5,120 | 31,160 |
| 86700 | 3,220 | -1,680 | 90,100 |
| Top CALL Volume: | |||
| Strike | OI | OI Change | Volume |
| 82000 | 7,63,040 | 6,38,180 | 1,51,59,060 |
| 81800 | 3,95,900 | 3,84,260 | 98,23,680 |
| Top PUT Open Interest: | |||
| Strike | OI | OI Change | Volume |
| 79000 | 4,24,380 | 1,96,860 | 52,90,820 |
| 78000 | 4,10,420 | 1,25,480 | 61,64,820 |
| Top PUT Open Interest addition: | |||
| Strike | OI | OI Change | Volume |
| 81500 | 3,84,880 | 2,53,980 | 1,53,64,360 |
| 77000 | 3,16,380 | 2,10,980 | 53,65,200 |
| Top PUT Open Interest reduction: | |||
| Strike | OI | OI Change | Volume |
| 82300 | 70,080 | -76,320 | 18,98,260 |
| 82500 | 2,52,200 | -66,120 | 18,63,600 |
| Top PUT Volume: | |||
| Strike | OI | OI Change | Volume |
| 81700 | 1,79,140 | 1,43,320 | 1,76,73,660 |
| 81800 | 1,59,300 | 93,820 | 1,67,77,320 |
NIFTY Weekly Expiry (2/03/2026)
The NIFTY index closed at 25178.65. The NIFTY weekly expiry for MARCH 2, 2026 has revealed key trends in open interest. The current Put/Call Ratio is at 0.456 against previous 0.692. The 26000CE option holds the maximum open interest, followed by the 25500CE and 25400CE options. Market participants have shown increased interest with significant open interest additions in the 25400CE option, with open interest additions also seen in the 25300CE and 25350CE options. On the other hand, open interest reductions were prominent in the 25400PE, 25500PE, and 25450PE options. Trading volume was highest in the 25300PE option, followed by the 25300CE and 25400CE options, indicating active trading in these strikes.
| NIFTY | Weekly | Expiry: | 02-03-2026 |
| Index Spot | PCR OI | Prev PCR OI | PCR VOL |
| 25,178.65 | 0.456 | 0.692 | 1.156 |
| Total Open Interest Change in all CALLs & PUTs: | |||
| Current | Prior | Net Ch | |
| CALL: | 24,17,48,845 | 15,83,04,445 | 8,34,44,400 |
| PUT: | 11,02,62,295 | 10,95,17,850 | 7,44,445 |
| Top CALL Open Interest: | |||
| Strike | OI | OI Change | Volume |
| 26,000 | 1,69,40,235 | 64,13,485 | 18,58,098 |
| 25,500 | 1,47,16,195 | 44,43,985 | 46,74,650 |
| Top CALL Open Interest addition: | |||
| Strike | OI | OI Change | Volume |
| 25,400 | 1,31,31,040 | 1,05,16,155 | 67,21,792 |
| 25,300 | 1,05,48,265 | 98,19,225 | 67,38,110 |
| Top CALL Open Interest reduction: | |||
| Strike | OI | OI Change | Volume |
| 26,700 | 32,02,355 | -11,58,430 | 4,91,575 |
| 27,300 | 8,76,265 | -9,00,705 | 1,36,562 |
| Top CALL Volume: | |||
| Strike | OI | OI Change | Volume |
| 25,300 | 1,05,48,265 | 98,19,225 | 67,38,110 |
| 25,400 | 1,31,31,040 | 1,05,16,155 | 67,21,792 |
| Top PUT Open Interest: | |||
| Strike | OI | OI Change | Volume |
| 25,000 | 85,11,555 | 12,22,520 | 42,99,243 |
| 24,000 | 81,59,905 | 2,35,365 | 8,92,153 |
| Top PUT Open Interest addition: | |||
| Strike | OI | OI Change | Volume |
| 23,100 | 80,63,835 | 23,65,675 | 3,50,867 |
| 25,100 | 44,89,745 | 17,47,005 | 39,38,974 |
| Top PUT Open Interest reduction: | |||
| Strike | OI | OI Change | Volume |
| 25,400 | 21,66,645 | -45,36,155 | 59,62,245 |
| 25,500 | 23,93,950 | -45,20,230 | 22,56,130 |
| Top PUT Volume: | |||
| Strike | OI | OI Change | Volume |
| 25,300 | 32,94,460 | -12,35,780 | 1,06,74,747 |
| 25,200 | 51,21,805 | 4,30,430 | 65,58,141 |
NIFTY Monthly Expiry (30/03/2026)
The NIFTY index closed at 25178.65. The NIFTY monthly expiry for MARCH 30, 2026 has revealed key trends in open interest. The current Put/Call Ratio is at 1.229 against previous 1.295. The 26000CE option holds the maximum open interest, followed by the 25000PE and 24000PE options. Market participants have shown increased interest with significant open interest additions in the 25500CE option, with open interest additions also seen in the 25300CE and 26000CE options. On the other hand, open interest reductions were prominent in the 25500PE, 26500CE, and 25000PE options. Trading volume was highest in the 26000CE option, followed by the 25500PE and 25500CE options, indicating active trading in these strikes.
| NIFTY | Monthly | Expiry: | 30-03-2026 |
| Index Spot | PCR OI | Prev PCR OI | PCR VOL |
| 25,178.65 | 1.229 | 1.295 | 0.936 |
| Total Open Interest Change in all CALLs & PUTs: | |||
| Current | Prior | Net Ch | |
| CALL: | 4,46,78,690 | 4,24,60,475 | 22,18,215 |
| PUT: | 5,49,10,280 | 5,49,88,835 | -78,555 |
| Top CALL Open Interest: | |||
| Strike | OI | OI Change | Volume |
| 26,000 | 63,33,630 | 4,37,035 | 1,10,916 |
| 27,000 | 40,32,500 | -2,08,815 | 32,020 |
| Top CALL Open Interest addition: | |||
| Strike | OI | OI Change | Volume |
| 25,500 | 33,94,300 | 7,26,830 | 1,07,201 |
| 25,300 | 5,79,345 | 4,44,535 | 29,857 |
| Top CALL Open Interest reduction: | |||
| Strike | OI | OI Change | Volume |
| 26,500 | 30,13,725 | -3,73,945 | 60,839 |
| 27,000 | 40,32,500 | -2,08,815 | 32,020 |
| Top CALL Volume: | |||
| Strike | OI | OI Change | Volume |
| 26,000 | 63,33,630 | 4,37,035 | 1,10,916 |
| 25,500 | 33,94,300 | 7,26,830 | 1,07,201 |
| Top PUT Open Interest: | |||
| Strike | OI | OI Change | Volume |
| 25,000 | 62,69,760 | -3,24,350 | 96,294 |
| 24,000 | 45,63,240 | -8,860 | 39,642 |
| Top PUT Open Interest addition: | |||
| Strike | OI | OI Change | Volume |
| 25,300 | 11,47,705 | 2,00,980 | 50,444 |
| 24,500 | 34,08,340 | 1,92,140 | 45,252 |
| Top PUT Open Interest reduction: | |||
| Strike | OI | OI Change | Volume |
| 25,500 | 34,23,680 | -4,09,825 | 1,10,500 |
| 25,000 | 62,69,760 | -3,24,350 | 96,294 |
| Top PUT Volume: | |||
| Strike | OI | OI Change | Volume |
| 25,500 | 34,23,680 | -4,09,825 | 1,10,500 |
| 25,000 | 62,69,760 | -3,24,350 | 96,294 |
BANKNIFTY Monthly Expiry (30/03/2026)
The BANKNIFTY index closed at 60529. The BANKNIFTY monthly expiry for MARCH 30, 2026 has revealed key trends in open interest. The current Put/Call Ratio is at 0.997 against previous 1.142. The 61000CE option holds the maximum open interest, followed by the 61000PE and 60000PE options. Market participants have shown increased interest with significant open interest additions in the 61000CE option, with open interest additions also seen in the 60800CE and 63000CE options. On the other hand, open interest reductions were prominent in the 61500PE, 61300PE, and 61000PE options. Trading volume was highest in the 61000PE option, followed by the 61000CE and 60500PE options, indicating active trading in these strikes.
| BANKNIFTY | Monthly | Expiry: | 30-03-2026 |
| Index Spot | PCR OI | Prev PCR OI | PCR VOL |
| 60,529.00 | 0.997 | 1.142 | 1.315 |
| Total Open Interest Change in all CALLs & PUTs: | |||
| Current | Prior | Net Ch | |
| CALL: | 1,01,46,490 | 88,83,900 | 12,62,590 |
| PUT: | 1,01,14,955 | 1,01,43,575 | -28,620 |
| Top CALL Open Interest: | |||
| Strike | OI | OI Change | Volume |
| 61,000 | 16,84,080 | 3,51,690 | 1,18,752 |
| 63,000 | 6,16,455 | 85,925 | 42,796 |
| Top CALL Open Interest addition: | |||
| Strike | OI | OI Change | Volume |
| 61,000 | 16,84,080 | 3,51,690 | 1,18,752 |
| 60,800 | 1,42,230 | 90,000 | 49,427 |
| Top CALL Open Interest reduction: | |||
| Strike | OI | OI Change | Volume |
| 67,000 | 1,81,890 | -12,930 | 9,619 |
| 61,400 | 1,13,280 | -7,080 | 14,318 |
| Top CALL Volume: | |||
| Strike | OI | OI Change | Volume |
| 61,000 | 16,84,080 | 3,51,690 | 1,18,752 |
| 61,500 | 5,77,375 | 69,580 | 57,712 |
| Top PUT Open Interest: | |||
| Strike | OI | OI Change | Volume |
| 61,000 | 15,89,520 | -48,450 | 1,42,104 |
| 60,000 | 10,52,970 | 5,840 | 80,505 |
| Top PUT Open Interest addition: | |||
| Strike | OI | OI Change | Volume |
| 59,300 | 71,730 | 43,770 | 6,441 |
| 59,200 | 61,230 | 33,900 | 4,912 |
| Top PUT Open Interest reduction: | |||
| Strike | OI | OI Change | Volume |
| 61,500 | 3,15,495 | -74,615 | 33,310 |
| 61,300 | 77,460 | -66,390 | 19,214 |
| Top PUT Volume: | |||
| Strike | OI | OI Change | Volume |
| 61,000 | 15,89,520 | -48,450 | 1,42,104 |
| 60,500 | 4,36,980 | -24,120 | 1,05,354 |
MIDCPNIFTY Monthly Expiry (30/03/2026)
The MIDCPNIFTY index closed at 13491.45. The MIDCPNIFTY monthly expiry for MARCH 30, 2026, 2025 has revealed key trends in open interest. The current Put/Call Ratio is at 1.082 against previous 1.077. The 14700CE option holds the maximum open interest, followed by the 13000PE and 12000PE options. Market participants have shown increased interest with significant open interest additions in the 12000PE option, with open interest additions also seen in the 14700CE and 14000CE options. On the other hand, open interest reductions were prominent in the 72900CE, 72900CE, and 72900CE options. Trading volume was highest in the 14000CE option, followed by the 13500PE and 13600PE options, indicating active trading in these strikes.
| MIDCPNIFTY | Monthly | Expiry: | 30-03-2026 |
| Index Spot | PCR OI | Prev PCR OI | PCR VOL |
| 13,491.45 | 1.082 | 1.077 | 1.033 |
| Total Open Interest Change in all CALLs & PUTs: | |||
| Current | Prior | Net Ch | |
| CALL: | 44,32,320 | 40,78,080 | 3,54,240 |
| PUT: | 47,94,600 | 43,93,800 | 4,00,800 |
| Top CALL Open Interest: | |||
| Strike | OI | OI Change | Volume |
| 14,700 | 7,79,640 | 1,29,000 | 4,789 |
| 14,000 | 4,52,520 | 1,16,640 | 15,710 |
| Top CALL Open Interest addition: | |||
| Strike | OI | OI Change | Volume |
| 14,700 | 7,79,640 | 1,29,000 | 4,789 |
| 14,000 | 4,52,520 | 1,16,640 | 15,710 |
| Top CALL Open Interest reduction: | |||
| Strike | OI | OI Change | Volume |
| 14,400 | 1,11,360 | -52,440 | 2,978 |
| 14,200 | 2,57,880 | -39,000 | 7,515 |
| Top CALL Volume: | |||
| Strike | OI | OI Change | Volume |
| 14,000 | 4,52,520 | 1,16,640 | 15,710 |
| 13,600 | 3,14,040 | 41,400 | 12,114 |
| Top PUT Open Interest: | |||
| Strike | OI | OI Change | Volume |
| 13,000 | 6,59,760 | 27,480 | 8,446 |
| 12,000 | 5,08,800 | 1,89,240 | 4,471 |
| Top PUT Open Interest addition: | |||
| Strike | OI | OI Change | Volume |
| 12,000 | 5,08,800 | 1,89,240 | 4,471 |
| 12,600 | 1,52,880 | 88,080 | 2,778 |
| Top PUT Open Interest reduction: | |||
| Strike | OI | OI Change | Volume |
| 13,300 | 2,36,160 | -67,200 | 4,491 |
| 13,600 | 2,37,240 | -54,600 | 13,498 |
| Top PUT Volume: | |||
| Strike | OI | OI Change | Volume |
| 13,500 | 4,89,600 | 4,800 | 13,689 |
| 13,600 | 2,37,240 | -54,600 | 13,498 |
Conclusion: What the NSE & BSE Indices Futures and Options Open Interest Volume Analysis Tells Us
Actionable Strategy (Cautious Bias)
Avoid aggressive longs until short covering is visible.
Intraday traders: Sell on rise near call addition zones.
Positional traders: Hedge portfolios below key supports.
Watch for:
PCR reversal
OI contraction on down moves
Premium compression
If those do not appear → Downside likely to extend.
Today’s Open Interest Volume Analysis clearly reflects derivative-driven weakness rather than emotional selling. The sharp expansion in futures open interest across NIFTY and BANKNIFTY, especially in April contracts, confirms strong institutional short positioning.
Weekly option chains show call-side dominance, while falling PCR levels signal reduced confidence among bulls.
Unless we witness short covering accompanied by declining open interest, rallies should be treated as selling opportunities rather than reversal signals.
Traders and investors should stay on the cautious side, hedge portfolios proactively, and avoid leverage-heavy positions until the Open Interest Volume Analysis starts showing contraction in bearish bets.
Check Previous Day’s NSE & BSE Indices F&O Analysis
FII / FPI trading activity in Capital Market Segment
NSE Derivatives Raw Data
BSE Derivatives Raw Data
Disclaimer
fnodata.com is a financial blog providing research-based data and analysis. The content creator of the fnodata.com is not a SEBI registered Investment Advisor. The content on this blog is for informational purposes only and should not be considered as investment advice. You are responsible for your own investment decisions. You should consult with a financial advisor or conduct your own research before making any investment decisions.