Turning Complex Derivative Data into Clear Market Insights

NSE & BSE Indices Futures and Options Open Interest Volume Analysis for 20/03/2026
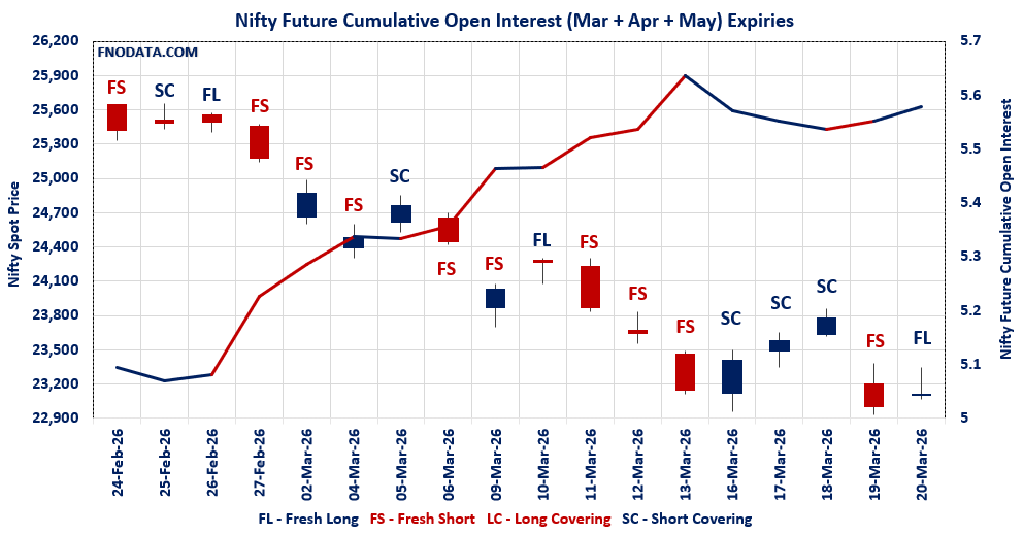
Table of Contents
oday’s Open Interest Volume Analysis clearly reflects a market that is trying to stabilize after recent volatility, but underneath the surface, positioning remains mixed and slightly fragile.
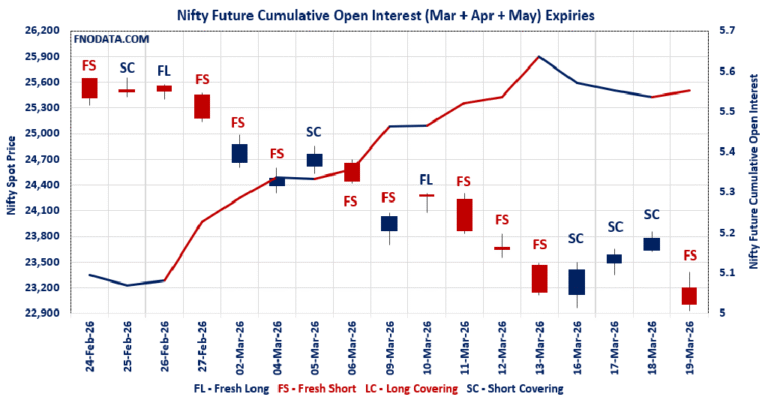
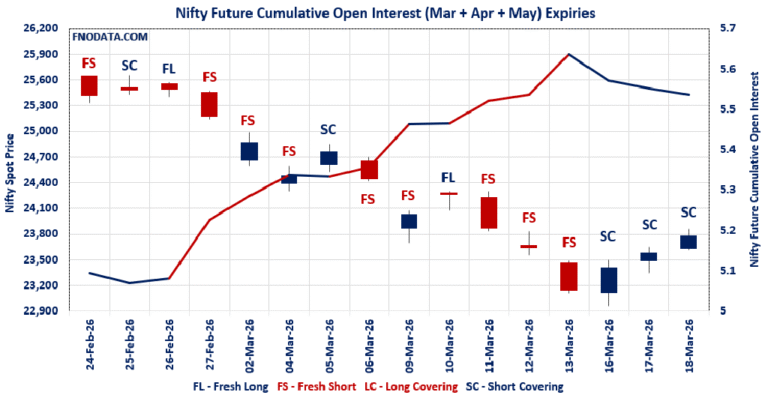
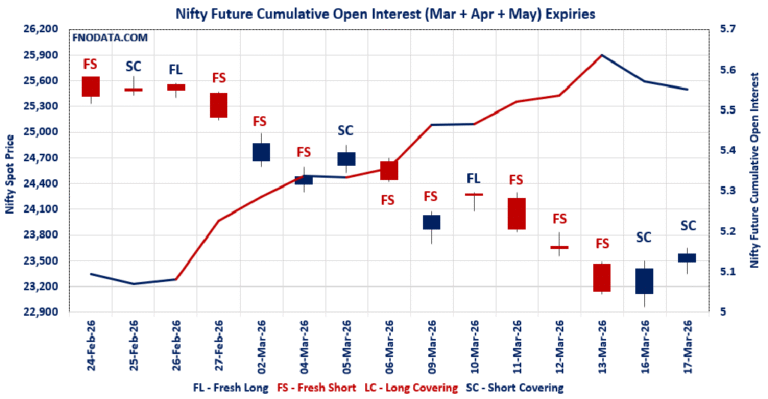
In NIFTY, we are seeing fresh long build-up (OI +2.80%) with declining volume (-6.53%), which is not the most convincing bullish signal — it indicates participation is narrowing, not expanding. Even though price is up ~0.5%, this kind of setup often suggests slow accumulation rather than aggressive buying.
The premium contraction across March & April futures further hints that bullish conviction is not very strong, despite longs getting added. This divergence is something traders should not ignore in their Open Interest Volume Analysis.
On the options side, weekly PCR rising (0.788) but still below 1, combined with heavy call writing at 24000–25000, clearly establishes a supply zone overhead, while put additions at 22000 provide a near-term cushion.
BANKNIFTY tells a completely different story — combined data shows fresh shorts with weak volume, and April futures confirming short build-up (+8.92% OI). This divergence between NIFTY and BANKNIFTY is a key risk factor and signals lack of broad-based strength.
Meanwhile, MIDCAPNIFTY is witnessing short covering, which is typically bullish, but again low volumes reduce conviction.
Overall, this Open Interest Volume Analysis suggests that markets are not in a clean trend — rather in a transition phase with conflicting signals across indices, making stock/index selection and risk management critical.
NSE & BSE F&O Market Signals
NIFTY Future analysis
NIFTY Spot closed at: 23114.5 (0.488%)
Combined = March + April + May
Combined Fut Open Interest Change: 2.80%
Combined Fut Volume Change: -6.53%
Combined Fut Open Interest Analysis: Fresh Long
Rollover: 24% Previous 22%
NIFTY March Future closed at: 23140.5 (0.372%)
March Fut Premium 26 (Decreased by -26.65 points)
March Fut Open Interest Change: 0.29%
March Fut Volume Change: -4.79%
March Fut Open Interest Analysis: Fresh Long
NIFTY April Future closed at: 23274.3 (0.327%)
April Fut Premium 159.8 (Decreased by -36.45 points)
April Fut Open Interest Change: 15.99%
April Fut Volume Change: -0.97%
April Fut Open Interest Analysis: Fresh Long
NIFTY Weekly Expiry (24/03/2026) Option Analysis
Put-Call Ratio (Open Interest): 0.788 (Increased from 0.710)
Put-Call Ratio (Volume): 1.027
Max Pain Level: 23250
Maximum CALL Open Interest: 25000
Maximum PUT Open Interest: 21000
Highest CALL Addition: 24000
Highest PUT Addition: 22000
NIFTY Monthly Expiry (30/03/2026) Option Analysis
Put-Call Ratio (Open Interest): 1.079 (Decreased from 1.084)
Put-Call Ratio (Volume): 0.895
Max Pain Level: 24000
Maximum CALL Open Interest: 26000
Maximum PUT Open Interest: 19000
Highest CALL Addition: 23500
Highest PUT Addition: 23000
BANKNIFTY Future Analysis
BANKNIFTY Spot closed at: 53427.05 (-0.045%)
Combined = March + April + May
Combined Fut Open Interest Change: 0.64%
Combined Fut Volume Change: -18.68%
Combined Fut Open Interest Analysis: Fresh Short
Rollover: 40% Previous 37%
BANKNIFTY MARCH Future closed at: 53554.2 (-0.093%)
March Fut Premium 127.15 (Decreased by -25.65 points)
March Fut Open Interest Change: -2.7%
March Fut Volume Change: -18.4%
March Fut Open Interest Analysis: Long Covering
BANKNIFTY APRIL Future closed at: 53933.4 (-0.032%)
April Fut Premium 506.35 (Increased by 6.95 points)
April Fut Open Interest Change: 8.92%
April Fut Volume Change: -17.05%
April Fut Open Interest Analysis: Fresh Short
BANKNIFTY Monthly Expiry (30/03/2026) Option Analysis
Put-Call Ratio (Open Interest): 0.795 (Increased from 0.787)
Put-Call Ratio (Volume): 0.840
Max Pain Level: 56000
Maximum CALL Open Interest: 59000
Maximum PUT Open Interest: 59000
Highest CALL Addition: 57000
Highest PUT Addition: 54000
MIDCPNIFTY Future Analysis
MIDCPNIFTY Spot closed at: 12625.9 (0.870%)
Combined = March + April + May
Combined Fut Open Interest Change: -3.07%
Combined Fut Volume Change: -13.53%
Combined Fut Open Interest Analysis: Short Covering
Rollover: 10% Previous 9%
MIDCPNIFTY MARCH Future closed at: 12621.6 (0.805%)
March Fut Discount -4.3 (Decreased by -8.05 points)
March Fut Open Interest Change: -3.48%
March Fut Volume Change: -10.39%
March Fut Open Interest Analysis: Short Covering
MIDCPNIFTY APRIL Future closed at: 12689.9 (0.673%)
April Fut Discount 64 (Decreased by -24.05 points)
April Fut Open Interest Change: 0.78%
April Fut Volume Change: -23.62%
April Fut Open Interest Analysis: Fresh Long
MIDCPNIFTY Monthly Expiry (30/03/2026) Option Analysis
Put-Call Ratio (Open Interest): 1.051 (Decreased from 1.054)
Put-Call Ratio (Volume): 1.024
Max Pain Level: 13000
Maximum CALL Open Interest: 13500
Maximum PUT Open Interest: 12000
Highest CALL Addition: 13700
Highest PUT Addition: 11400
SENSEX Monthly Expiry (25/03/2026) Future
SENSEX Spot closed at: 74,532.96 (0.439%)
SENSEX Monthly Future closed at: 74,597.00 (0.434%)
Premium: 64.04 (Decreased by -3.67 points)
Open Interest Change: -13.21%
Volume Change: -38.95%
Open Interest Analysis: Short Covering
SENSEX Weekly Expiry (25/03/2026) Option Analysis
Put-Call Ratio (OI): 0.869 (Increased from 0.768)
Put-Call Ratio (Volume): 0.950
Max Pain Level: 75000
Maximum CALL OI: 79000
Maximum PUT OI: 70000
Highest CALL Addition: 75100
Highest PUT Addition: 68000
FII & DII Cash Market Activity
FIIs Net SELL: ₹ 5,518.39 Cr.
DIIs Net BUY: ₹ 5,706.23 Cr.
FII Derivatives Activity
| FII Trading Stats | 20.03.26 | 19.03.26 | 18.03.26 |
| FII Cash (Provisional Data) | -5,518.39 | -7,558.19 | -2,714.35 |
| Index Future Open Interest Long Ratio | 14.36% | 14.14% | 14.12% |
| Index Future Volume Long Ratio | 46.58% | 48.25% | 64.65% |
| Call Option Open Interest Long Ratio | 42.02% | 41.86% | 42.70% |
| Call Option Volume Long Ratio | 49.83% | 49.67% | 49.90% |
| Put Option Open Interest Long Ratio | 63.19% | 63.51% | 62.62% |
| Put Option Volume Long Ratio | 50.17% | 50.39% | 49.85% |
| Stock Future Open Interest Long Ratio | 56.99% | 57.12% | 58.08% |
| Stock Future Volume Long Ratio | 49.79% | 42.82% | 47.21% |
| Index Futures | Fresh Short | Long Covering | Short Covering |
| Index Options | Fresh Short | Fresh Short | Fresh Short |
| Nifty Futures | Fresh Short | Long Covering | Short Covering |
| Nifty Options | Fresh Long | Fresh Long | Fresh Short |
| BankNifty Futures | Fresh Long | Fresh Long | Fresh Long |
| BankNifty Options | Fresh Short | Fresh Short | Fresh Long |
| FinNifty Futures | Fresh Long | Long Covering | Long Covering |
| FinNifty Options | Fresh Short | Long Covering | Fresh Long |
| MidcpNifty Futures | Short Covering | Short Covering | Fresh Long |
| MidcpNifty Options | Fresh Long | Fresh Short | Fresh Long |
| NiftyNxt50 Futures | Long Covering | Short Covering | Fresh Short |
| NiftyNxt50 Options | Fresh Long | Long Covering | Fresh Long |
| Stock Futures | Fresh Long | Long Covering | Fresh Short |
| Stock Options | Fresh Short | Fresh Long | Fresh Short |
Fresh Long: Net Buy with Increase in Open Interest
Fresh Short: Net Sell with Increase in Open Interest
Short Covering: Net Buy with Decrease in Open Interest
Long Covering: Net Sell with Decrease in Open Interest
NSE & BSE Option market Trends : Options Insights
SENSEX weekly Expiry (25/03/2026)
The SENSEX index closed at 74532.96. The SENSEX weekly expiry for MARCH 25, 2026 has revealed key trends in open interest. The current Put/Call Ratio is at 0.869 against previous 0.768. The 79000CE option holds the maximum open interest, followed by the 75000CE and 80000CE options. Market participants have shown increased interest with significant open interest additions in the 68000PE option, with open interest additions also seen in the 75100CE and 69000PE options. On the other hand, open interest reductions were prominent in the 74200CE, 74000CE, and 74100CE options. Trading volume was highest in the 75000PE option, followed by the 75000CE and 76000CE options, indicating active trading in these strikes.
| SENSEX | Weekly | Expiry: | 25-03-2026 |
| Index Spot | PCR OI | Prev PCR OI | PCR VOL |
| 74532.96 | 0.869 | 0.768 | 0.950 |
| Total Open Interest Change in all CALLs & PUTs: | |||
| Current | Prior | Net Ch | |
| CALL: | 81,83,160 | 45,05,260 | 36,77,900 |
| PUT: | 71,11,380 | 34,61,020 | 36,50,360 |
| Top CALL Open Interest: | |||
| Strike | OI | OI Change | Volume |
| 79000 | 4,14,640 | 1,39,720 | 60,87,500 |
| 75000 | 4,06,960 | 1,35,780 | 1,41,73,640 |
| Top CALL Open Interest addition: | |||
| Strike | OI | OI Change | Volume |
| 75100 | 2,60,020 | 1,83,880 | 69,38,680 |
| 78000 | 3,27,520 | 1,59,180 | 45,56,580 |
| Top CALL Open Interest reduction: | |||
| Strike | OI | OI Change | Volume |
| 74200 | 48,220 | -21,000 | 4,11,960 |
| 74000 | 1,14,900 | -14,820 | 6,94,820 |
| Top CALL Volume: | |||
| Strike | OI | OI Change | Volume |
| 75000 | 4,06,960 | 1,35,780 | 1,41,73,640 |
| 76000 | 3,47,560 | 79,400 | 79,00,540 |
| Top PUT Open Interest: | |||
| Strike | OI | OI Change | Volume |
| 70000 | 3,15,680 | 1,45,560 | 51,99,200 |
| 75000 | 3,01,660 | 1,57,240 | 1,44,87,200 |
| Top PUT Open Interest addition: | |||
| Strike | OI | OI Change | Volume |
| 68000 | 2,86,280 | 2,17,280 | 33,34,040 |
| 69000 | 2,42,400 | 1,72,120 | 31,65,800 |
| Top PUT Open Interest reduction: | |||
| Strike | OI | OI Change | Volume |
| 77000 | 98,180 | -5,800 | 34,800 |
| 74100 | 52,320 | -2,140 | 18,85,340 |
| Top PUT Volume: | |||
| Strike | OI | OI Change | Volume |
| 75000 | 3,01,660 | 1,57,240 | 1,44,87,200 |
| 74000 | 2,26,960 | 3,740 | 77,00,760 |
NIFTY Weekly Expiry (24/03/2026)
The NIFTY index closed at 23114.5. The NIFTY weekly expiry for MARCH 24, 2026 has revealed key trends in open interest. The current Put/Call Ratio is at 0.788 against previous 0.710. The 25000CE option holds the maximum open interest, followed by the 21000PE and 24000CE options. Market participants have shown increased interest with significant open interest additions in the 22000PE option, with open interest additions also seen in the 21500PE and 24000CE options. On the other hand, open interest reductions were prominent in the 27500CE, 23000CE, and 25200CE options. Trading volume was highest in the 23300CE option, followed by the 23200PE and 23000PE options, indicating active trading in these strikes.
| NIFTY | Weekly | Expiry: | 24-03-2026 |
| Index Spot | PCR OI | Prev PCR OI | PCR VOL |
| 23,114.50 | 0.788 | 0.710 | 1.027 |
| Total Open Interest Change in all CALLs & PUTs: | |||
| Current | Prior | Net Ch | |
| CALL: | 13,71,18,150 | 11,89,19,580 | 1,81,98,570 |
| PUT: | 10,80,11,085 | 8,44,42,475 | 2,35,68,610 |
| Top CALL Open Interest: | |||
| Strike | OI | OI Change | Volume |
| 25,000 | 91,55,575 | 6,76,260 | 7,07,764 |
| 24,000 | 85,69,470 | 17,81,260 | 21,91,573 |
| Top CALL Open Interest addition: | |||
| Strike | OI | OI Change | Volume |
| 24,000 | 85,69,470 | 17,81,260 | 21,91,573 |
| 23,800 | 55,93,250 | 13,44,850 | 17,59,758 |
| Top CALL Open Interest reduction: | |||
| Strike | OI | OI Change | Volume |
| 27,500 | 7,28,780 | -6,79,965 | 41,324 |
| 23,000 | 27,08,485 | -5,85,975 | 6,17,570 |
| Top CALL Volume: | |||
| Strike | OI | OI Change | Volume |
| 23,300 | 50,74,290 | 7,55,235 | 40,75,145 |
| 23,500 | 52,78,520 | 8,42,010 | 33,10,254 |
| Top PUT Open Interest: | |||
| Strike | OI | OI Change | Volume |
| 21,000 | 89,46,925 | 2,30,425 | 6,40,532 |
| 22,000 | 83,05,895 | 26,52,845 | 15,53,352 |
| Top PUT Open Interest addition: | |||
| Strike | OI | OI Change | Volume |
| 22,000 | 83,05,895 | 26,52,845 | 15,53,352 |
| 21,500 | 50,43,935 | 18,42,035 | 6,33,161 |
| Top PUT Open Interest reduction: | |||
| Strike | OI | OI Change | Volume |
| 20,950 | 45,85,880 | -3,09,140 | 1,61,831 |
| 23,600 | 10,11,075 | -2,65,395 | 1,03,275 |
| Top PUT Volume: | |||
| Strike | OI | OI Change | Volume |
| 23,200 | 25,67,760 | 8,58,780 | 40,39,308 |
| 23,000 | 63,33,795 | -1,93,570 | 37,36,735 |
NIFTY Monthly Expiry (30/03/2026)
The NIFTY index closed at 23114.5. The NIFTY monthly expiry for MARCH 30, 2026 has revealed key trends in open interest. The current Put/Call Ratio is at 1.079 against previous 1.084. The 19000PE option holds the maximum open interest, followed by the 20000PE and 26000CE options. Market participants have shown increased interest with significant open interest additions in the 23500CE option, with open interest additions also seen in the 23200CE and 23000PE options. On the other hand, open interest reductions were prominent in the 22000PE, 26000CE, and 24000PE options. Trading volume was highest in the 24000CE option, followed by the 23000PE and 23500CE options, indicating active trading in these strikes.
| NIFTY | Monthly | Expiry: | 30-03-2026 |
| Index Spot | PCR OI | Prev PCR OI | PCR VOL |
| 23,114.50 | 1.079 | 1.084 | 0.895 |
| Total Open Interest Change in all CALLs & PUTs: | |||
| Current | Prior | Net Ch | |
| CALL: | 6,86,07,350 | 6,57,64,455 | 28,42,895 |
| PUT: | 7,40,25,110 | 7,13,07,400 | 27,17,710 |
| Top CALL Open Interest: | |||
| Strike | OI | OI Change | Volume |
| 26,000 | 52,22,015 | -2,72,575 | 38,757 |
| 24,000 | 49,15,640 | 1,59,275 | 2,12,920 |
| Top CALL Open Interest addition: | |||
| Strike | OI | OI Change | Volume |
| 23,500 | 36,29,730 | 6,25,235 | 1,71,365 |
| 23,200 | 16,77,260 | 5,32,935 | 1,26,440 |
| Top CALL Open Interest reduction: | |||
| Strike | OI | OI Change | Volume |
| 26,000 | 52,22,015 | -2,72,575 | 38,757 |
| 28,000 | 13,24,955 | -1,40,005 | 6,655 |
| Top CALL Volume: | |||
| Strike | OI | OI Change | Volume |
| 24,000 | 49,15,640 | 1,59,275 | 2,12,920 |
| 23,500 | 36,29,730 | 6,25,235 | 1,71,365 |
| Top PUT Open Interest: | |||
| Strike | OI | OI Change | Volume |
| 19,000 | 57,62,080 | 2,69,990 | 43,156 |
| 20,000 | 52,30,810 | 3,04,115 | 60,410 |
| Top PUT Open Interest addition: | |||
| Strike | OI | OI Change | Volume |
| 23,000 | 44,29,500 | 5,25,335 | 2,08,467 |
| 21,500 | 21,58,260 | 4,32,185 | 71,670 |
| Top PUT Open Interest reduction: | |||
| Strike | OI | OI Change | Volume |
| 22,000 | 48,46,205 | -3,14,815 | 1,46,620 |
| 24,000 | 32,58,535 | -2,28,305 | 22,362 |
| Top PUT Volume: | |||
| Strike | OI | OI Change | Volume |
| 23,000 | 44,29,500 | 5,25,335 | 2,08,467 |
| 23,200 | 17,31,535 | 4,05,275 | 1,52,046 |
BANKNIFTY Monthly Expiry (30/03/2026)
The BANKNIFTY index closed at 53427.05. The BANKNIFTY monthly expiry for MARCH 30, 2026 has revealed key trends in open interest. The current Put/Call Ratio is at 0.795 against previous 0.787. The 59000CE option holds the maximum open interest, followed by the 61000CE and 60000CE options. Market participants have shown increased interest with significant open interest additions in the 57000CE option, with open interest additions also seen in the 54000CE and 59500CE options. On the other hand, open interest reductions were prominent in the 56000CE, 51000PE, and 55400CE options. Trading volume was highest in the 54000PE option, followed by the 54000CE and 55000CE options, indicating active trading in these strikes.
| BANKNIFTY | Monthly | Expiry: | 30-03-2026 |
| Index Spot | PCR OI | Prev PCR OI | PCR VOL |
| 53,427.05 | 0.795 | 0.787 | 0.840 |
| Total Open Interest Change in all CALLs & PUTs: | |||
| Current | Prior | Net Ch | |
| CALL: | 1,90,34,640 | 1,89,71,770 | 62,870 |
| PUT: | 1,51,34,940 | 1,49,35,075 | 1,99,865 |
| Top CALL Open Interest: | |||
| Strike | OI | OI Change | Volume |
| 59,000 | 11,03,580 | -48,600 | 59,014 |
| 61,000 | 10,91,460 | 1,740 | 25,403 |
| Top CALL Open Interest addition: | |||
| Strike | OI | OI Change | Volume |
| 57,000 | 7,24,485 | 1,10,420 | 1,01,968 |
| 54,000 | 5,03,340 | 83,670 | 1,65,410 |
| Top CALL Open Interest reduction: | |||
| Strike | OI | OI Change | Volume |
| 56,000 | 8,40,270 | -1,72,890 | 1,29,252 |
| 55,400 | 1,13,940 | -71,130 | 28,077 |
| Top CALL Volume: | |||
| Strike | OI | OI Change | Volume |
| 54,000 | 5,03,340 | 83,670 | 1,65,410 |
| 55,000 | 7,21,800 | 12,390 | 1,43,615 |
| Top PUT Open Interest: | |||
| Strike | OI | OI Change | Volume |
| 59,000 | 6,86,370 | -1,890 | 260 |
| 54,000 | 6,72,110 | 69,430 | 1,73,468 |
| Top PUT Open Interest addition: | |||
| Strike | OI | OI Change | Volume |
| 54,000 | 6,72,110 | 69,430 | 1,73,468 |
| 46,000 | 67,740 | 67,740 | 13,317 |
| Top PUT Open Interest reduction: | |||
| Strike | OI | OI Change | Volume |
| 51,000 | 6,62,970 | -81,600 | 86,693 |
| 52,500 | 3,95,495 | -68,700 | 58,777 |
| Top PUT Volume: | |||
| Strike | OI | OI Change | Volume |
| 54,000 | 6,72,110 | 69,430 | 1,73,468 |
| 53,500 | 4,98,480 | -7,950 | 1,21,075 |
MIDCPNIFTY Monthly Expiry (30/03/2026)
The MIDCPNIFTY index closed at 12625.9. The MIDCPNIFTY monthly expiry for MARCH 30, 2026, 2025 has revealed key trends in open interest. The current Put/Call Ratio is at 1.051 against previous 1.054. The 12000PE option holds the maximum open interest, followed by the 12500PE and 13500CE options. Market participants have shown increased interest with significant open interest additions in the 13700CE option, with open interest additions also seen in the 11400PE and 13000CE options. On the other hand, open interest reductions were prominent in the 67000CE, 66500CE, and 66900PE options. Trading volume was highest in the 12200PE option, followed by the 12700CE and 12700PE options, indicating active trading in these strikes.
| MIDCPNIFTY | Monthly | Expiry: | 30-03-2026 |
| Index Spot | PCR OI | Prev PCR OI | PCR VOL |
| 12,625.90 | 1.051 | 1.054 | 1.024 |
| Total Open Interest Change in all CALLs & PUTs: | |||
| Current | Prior | Net Ch | |
| CALL: | 76,47,480 | 72,50,160 | 3,97,320 |
| PUT: | 80,34,960 | 76,39,560 | 3,95,400 |
| Top CALL Open Interest: | |||
| Strike | OI | OI Change | Volume |
| 13,500 | 7,26,480 | 84,240 | 7,813 |
| 13,000 | 6,87,240 | 1,01,640 | 14,049 |
| Top CALL Open Interest addition: | |||
| Strike | OI | OI Change | Volume |
| 13,700 | 5,31,960 | 2,74,800 | 5,504 |
| 13,000 | 6,87,240 | 1,01,640 | 14,049 |
| Top CALL Open Interest reduction: | |||
| Strike | OI | OI Change | Volume |
| 13,100 | 2,48,280 | -48,480 | 8,823 |
| 13,300 | 3,13,320 | -39,240 | 4,832 |
| Top CALL Volume: | |||
| Strike | OI | OI Change | Volume |
| 12,700 | 2,60,040 | 28,200 | 19,560 |
| 13,000 | 6,87,240 | 1,01,640 | 14,049 |
| Top PUT Open Interest: | |||
| Strike | OI | OI Change | Volume |
| 12,000 | 8,46,960 | 17,520 | 12,262 |
| 12,500 | 7,32,480 | -70,080 | 13,488 |
| Top PUT Open Interest addition: | |||
| Strike | OI | OI Change | Volume |
| 11,400 | 4,82,520 | 1,28,160 | 3,671 |
| 11,000 | 76,560 | 76,560 | 2,295 |
| Top PUT Open Interest reduction: | |||
| Strike | OI | OI Change | Volume |
| 12,500 | 7,32,480 | -70,080 | 13,488 |
| 12,200 | 2,76,360 | -45,120 | 19,799 |
| Top PUT Volume: | |||
| Strike | OI | OI Change | Volume |
| 12,200 | 2,76,360 | -45,120 | 19,799 |
| 12,700 | 2,18,400 | 39,000 | 18,621 |
Conclusion: What the NSE & BSE Indices Futures and Options Open Interest Volume Analysis Tells Us
- Summarizing this Open Interest Volume Analysis, the market is showing selective strength but not broad confirmation, which is a classic sign of a fragile up-move.
- NIFTY’s fresh longs without volume support + falling premiums indicate that upside may remain slow and capped near 23500–24000 zones, where aggressive call writing is visible.
- BANKNIFTY’s continued short bias is a major red flag — until banking participates, any rally in NIFTY can remain unsustainable or prone to sharp reversals.
- MIDCAP strength due to short covering can provide temporary support, but it is not a structural bullish trigger yet.
- Key levels to watch based on this data:
- Support: 22800–23000 (put base forming)
- Resistance: 23500–24000 (heavy call supply zone)
- Strategy-wise:
- Avoid aggressive longs at higher levels — buy on dips with strict risk management
- Prefer hedged strategies (like spreads) instead of naked positions
- Watch for volume expansion — that will confirm the next directional move
Final takeaway: This Open Interest Volume Analysis is not signaling a strong trending market yet — it’s a “cautious optimism with underlying weakness” phase. Traders should stay nimble, protect capital, and avoid over-leveraging until clearer confirmation emerges.
Check Previous Day’s NSE & BSE Indices F&O Analysis
FII / FPI trading activity in Capital Market Segment
NSE Derivatives Raw Data
BSE Derivatives Raw Data
Disclaimer
fnodata.com is a financial blog providing research-based data and analysis. The content creator of the fnodata.com is not a SEBI registered Investment Advisor. The content on this blog is for informational purposes only and should not be considered as investment advice. You are responsible for your own investment decisions. You should consult with a financial advisor or conduct your own research before making any investment decisions.