Turning Complex Derivative Data into Clear Market Insights

NSE & BSE Indices Futures and Options Open Interest Volume Analysis for 3/08/2026

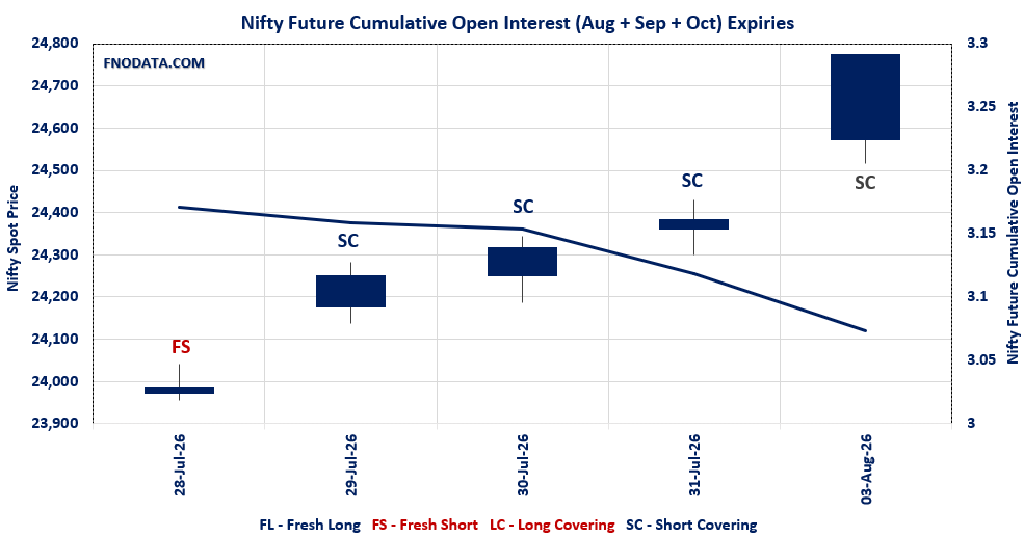
Table of Contents
The CAS Regime Effect: Welcome back, traders! If you’re looking at today’s closing data (August 3, 2026) and scratching your head over the massive future discounts—like Nifty’s 124-point dip or BankNifty’s extreme 386-point discount—don’t panic. Today marks the official launch of the NSE’s new Closing Auction Session (CAS) regime.Why the Parity is Broken: Because cash markets for F&O-eligible stocks now freeze continuous trading at 3:15 PM to discover the spot closing price via an auction pool, while derivatives continue trading until 3:40 PM, this 25-minute mismatch is creating wild, artificial spot-future spreads. The futures are simply pricing in late-market volatility that the frozen spot index can no longer reflect.
Why the Parity is Broken: Because cash markets for F&O-eligible stocks now freeze continuous trading at 3:15 PM to discover the spot closing price via an auction pool, while derivatives continue trading until 3:40 PM, this 25-minute mismatch is creating wild, artificial spot-future spreads. The futures are simply pricing in late-market volatility that the frozen spot index can no longer reflect.
Cutting Through the Noise: With surface-level premiums and discounts rendered temporarily deceptive, relying on deep Open Interest Volume Analysis is our absolute best edge right now to track where the smart money is actually flowing. Despite the optical discounts on your screens, the internal data is screaming aggressive “Short Covering” in benchmark indices and confident “Fresh Longs” in Midcaps. Let’s break down the hidden signals.
NSE & BSE F&O Market Signals
NIFTY Future analysis
NIFTY Spot closed at: 24774.3 (1.602%)
Combined = August + September + October
Combined Fut Open Interest Change: -4.53%
Combined Fut Volume Change: 39.18%
Combined Fut Open Interest Analysis: Short Covering
Rollover: 10% Previous 8%
NIFTY AUGUST Future closed at: 24649.4 (0.805%)
Aug Fut Discount -124.9 (Decreased by -193.9 points)
Aug Fut Open Interest Change: -5.74%
Aug Fut Volume Change: 36.43%
Aug Fut Open Interest Analysis: Short Covering
NIFTY SEPTEMBER Future closed at: 24760 (0.784%)
Sep Fut Discount -14.3 (Decreased by -198.2 points)
Sep Fut Open Interest Change: 6.44%
Sep Fut Volume Change: 68.88%
Sep Fut Open Interest Analysis: Fresh Long
NIFTY Weekly Expiry (04/08/2026) Option Analysis
Put-Call Ratio (Open Interest): 1.572 (Increased from 1.494)
Put-Call Ratio (Volume): 1.004
Max Pain Level: 24550
Maximum CALL Open Interest: 24600
Maximum PUT Open Interest: 24200
Highest CALL Addition: 24800
Highest PUT Addition: 24600
NIFTY Monthly Expiry (25/08/2026) Option Analysis
Put-Call Ratio (Open Interest): 1.115 (Decreased from 1.140)
Put-Call Ratio (Volume): 1.105
Max Pain Level: 24400
Maximum CALL Open Interest: 24000
Maximum PUT Open Interest: 24000
Highest CALL Addition: 24600
Highest PUT Addition: 24500
BANKNIFTY Future Analysis
BANKNIFTY Spot closed at: 58247.95 (1.717%)
Combined = August + September + October
Combined Fut Open Interest Change: -0.86%
Combined Fut Volume Change: 61.53%
Combined Fut Open Interest Analysis: Short Covering
Rollover: 8% Previous 8%
BANKNIFTY AUGUST Future closed at: 57861.6 (0.760%)
Aug Fut Discount -386.35 (Decreased by -546.7 points)
Aug Fut Open Interest Change: -0.7%
Aug Fut Volume Change: 59.3%
Aug Fut Open Interest Analysis: Short Covering
BANKNIFTY SEPTEMBER Future closed at: 58251.4 (0.798%)
Sep Fut Discount 3.45 (Decreased by -522.1 points)
Sep Fut Open Interest Change: -4.72%
Sep Fut Volume Change: 90.11%
Sep Fut Open Interest Analysis: Short Covering
BANKNIFTY Monthly Expiry (25/08/2026) Option Analysis
Put-Call Ratio (Open Interest): 0.887 (Increased from 0.857)
Put-Call Ratio (Volume): 0.738
Max Pain Level: 57800
Maximum CALL Open Interest: 58000
Maximum PUT Open Interest: 58000
Highest CALL Addition: 59000
Highest PUT Addition: 58000
MIDCPNIFTY Future Analysis
MIDCPNIFTY Spot closed at: 14898.15 (0.769%)
Combined = August + September + October
Combined Fut Open Interest Change: 2.72%
Combined Fut Volume Change: 30.39%
Combined Fut Open Interest Analysis: Fresh Long
Rollover: 3% Previous 3%
MIDCPNIFTY AUGUST Future closed at: 14860.15 (0.294%)
Aug Fut Discount-38 (Decreased by -70.15 points)
Aug Fut Open Interest Change: 2.29%
Aug Fut Volume Change: 31.20%
Aug Fut Open Interest Analysis: Fresh Long
MIDCPNIFTY SEPTEMBER Future closed at: 14908.8 (0.360%)
Sep Fut Premium10.65 (Decreased by -60.3 points)
Sep Fut Open Interest Change: 17.80%
Sep Fut Volume Change: 34.58%
Sep Fut Open Interest Analysis: Fresh Long
MIDCPNIFTY Monthly Expiry (25/08/2026) Option Analysis
Put-Call Ratio (Open Interest): 1.090 (Increased from 1.056)
Put-Call Ratio (Volume): 1.150
Max Pain Level: 14800
Maximum CALL Open Interest: 15500
Maximum PUT Open Interest: 13600
Highest CALL Addition: 14900
Highest PUT Addition: 14900
SENSEX Monthly Expiry (27/08/2026) Future
SENSEX Spot closed at: 78,639.03 (0.697%)
SENSEX Monthly Future closed at: 78,936.50 (0.687%)
Premium: 297.47 (Decreased by -5.69 points)
Open Interest Change: 7.13%
Volume Change: -2.38%
Open Interest Analysis: Fresh Long
SENSEX Weekly Expiry (06/08/2026) Option Analysis
Put-Call Ratio (OI): 1.307 (Increased from 1.197)
Put-Call Ratio (Volume): 0.902
Max Pain Level: 78500
Maximum CALL OI: 79000
Maximum PUT OI: 78000
Highest CALL Addition: 79000
Highest PUT Addition: 78500
FII & DII Cash Market Activity
FIIs Net BUY: ₹922.26 Cr.
DIIs Net BUY: ₹ 1,571.18 Cr.
FII Derivatives Activity
| FII Trading Stats | 3.08.26 | 31.07.26 | 30.07.26 |
| FII Cash (Provisional Data) | 922.26 | 277.48 | 3,623.51 |
| Index Future Open Interest Long Ratio | 13.02% | 11.12% | 10.38% |
| Index Future Volume Long Ratio | 79.96% | 81.22% | 63.99% |
| Call Option Open Interest Long Ratio | 44.43% | 41.53% | 41.40% |
| Call Option Volume Long Ratio | 50.46% | 49.92% | 49.78% |
| Put Option Open Interest Long Ratio | 64.03% | 66.66% | 69.07% |
| Put Option Volume Long Ratio | 49.85% | 50.11% | 49.51% |
| Stock Future Open Interest Long Ratio | 55.07% | 55.06% | 54.88% |
| Stock Future Volume Long Ratio | 49.94% | 51.70% | 49.63% |
| Index Futures | Short Covering | Short Covering | Short Covering |
| Index Options | Fresh Long | Fresh Long | Fresh Short |
| Nifty Futures | Short Covering | Short Covering | Short Covering |
| Nifty Options | Fresh Long | Fresh Long | Fresh Short |
| BankNifty Futures | Fresh Long | Fresh Long | Fresh Short |
| BankNifty Options | Fresh Long | Fresh Long | Fresh Long |
| FinNifty Futures | Long Covering | Fresh Long | Long Covering |
| FinNifty Options | Fresh Long | Fresh Long | Fresh Short |
| MidcpNifty Futures | Short Covering | Fresh Short | Short Covering |
| MidcpNifty Options | Fresh Long | Fresh Short | Fresh Long |
| NiftyNxt50 Futures | Fresh Short | Fresh Short | Long Covering |
| NiftyNxt50 Options | Fresh Long | Fresh Long | Fresh Short |
| Stock Futures | Fresh Short | Fresh Long | Long Covering |
| Stock Options | Fresh Short | Fresh Short | Fresh Short |
NSE & BSE Option market Trends : Options Insights
SENSEX weekly Expiry (06/08/2026)
The SENSEX index closed at 78639.03. The SENSEX weekly expiry for AUGUST 6, 2026 has revealed key trends in open interest. The current Put/Call Ratio is at 1.307 against previous 1.197. The 79000CE option holds the maximum open interest, followed by the 80000CE and 78000PE options. Market participants have shown increased interest with significant open interest additions in the 78500PE option, with open interest additions also seen in the 79000CE and 78700PE options. On the other hand, open interest reductions were prominent in the 78000CE, 78100CE, and 78300CE options. Trading volume was highest in the 78700CE option, followed by the 79000CE and 78700PE options, indicating active trading in these strikes.
| SENSEX | Weekly | Expiry: | 06-08-2026 |
| Index Spot | PCR OI | Prev PCR OI | PCR VOL |
| 78639.03 | 1.307 | 1.197 | 0.902 |
| Total Open Interest Change in all CALLs & PUTs: | |||
| Current | Prior | Net Ch | |
| CALL: | 1,12,57,000 | 89,31,660 | 23,25,340 |
| PUT: | 1,47,10,660 | 1,06,95,400 | 40,15,260 |
| Top CALL Open Interest: | |||
| Strike | OI | OI Change | Volume |
| 79000 | 10,41,680 | 4,66,940 | 1,74,69,280 |
| 80000 | 9,83,020 | 2,94,140 | 87,77,440 |
| Top CALL Open Interest addition: | |||
| Strike | OI | OI Change | Volume |
| 79000 | 10,41,680 | 4,66,940 | 1,74,69,280 |
| 78700 | 5,22,620 | 4,00,900 | 1,88,42,700 |
| Top CALL Open Interest reduction: | |||
| Strike | OI | OI Change | Volume |
| 78000 | 3,20,380 | -3,09,920 | 19,23,320 |
| 78100 | 67,060 | -2,68,120 | 10,03,680 |
| Top CALL Volume: | |||
| Strike | OI | OI Change | Volume |
| 78700 | 5,22,620 | 4,00,900 | 1,88,42,700 |
| 79000 | 10,41,680 | 4,66,940 | 1,74,69,280 |
| Top PUT Open Interest: | |||
| Strike | OI | OI Change | Volume |
| 78000 | 8,98,680 | 1,45,840 | 1,01,48,380 |
| 77000 | 8,50,520 | 3,59,900 | 46,74,080 |
| Top PUT Open Interest addition: | |||
| Strike | OI | OI Change | Volume |
| 78500 | 7,62,060 | 6,40,460 | 1,28,00,260 |
| 78700 | 4,61,760 | 4,43,040 | 1,73,15,620 |
| Top PUT Open Interest reduction: | |||
| Strike | OI | OI Change | Volume |
| 75700 | 69,840 | -84,480 | 9,39,920 |
| 73500 | 2,19,260 | -77,140 | 12,29,520 |
| Top PUT Volume: | |||
| Strike | OI | OI Change | Volume |
| 78700 | 4,61,760 | 4,43,040 | 1,73,15,620 |
| 78600 | 3,48,140 | 3,29,860 | 1,35,18,620 |
NIFTY Weekly Expiry (04/08/2026)
The NIFTY index closed at 24774.3. The NIFTY weekly expiry for AUGUST 4, 2026 has revealed key trends in open interest. The current Put/Call Ratio is at 1.572 against previous 1.494. The 24600CE option holds the maximum open interest, followed by the 24200PE and 24000PE options. Market participants have shown increased interest with significant open interest additions in the 24600PE option, with open interest additions also seen in the 24500PE and 24550PE options. On the other hand, open interest reductions were prominent in the 24400CE, 24500CE, and 23650PE options. Trading volume was highest in the 24600CE option, followed by the 24600PE and 24550PE options, indicating active trading in these strikes.
| NIFTY | Weekly | Expiry: | 04-08-2026 |
| Index Spot | PCR OI | Prev PCR OI | PCR VOL |
| 24,774.30 | 1.572 | 1.494 | 1.004 |
| Total Open Interest Change in all CALLs & PUTs: | |||
| Current | Prior | Net Ch | |
| CALL: | 13,18,29,425 | 13,03,05,207 | 15,24,218 |
| PUT: | 20,72,85,845 | 19,46,88,097 | 1,25,97,748 |
| Top CALL Open Interest: | |||
| Strike | OI | OI Change | Volume |
| 24,600 | 1,50,62,970 | 30,28,187 | 1,13,72,067 |
| 25,000 | 1,18,87,135 | 9,87,285 | 19,22,012 |
| Top CALL Open Interest addition: | |||
| Strike | OI | OI Change | Volume |
| 24,800 | 1,16,77,835 | 48,48,025 | 38,88,481 |
| 24,600 | 1,50,62,970 | 30,28,187 | 1,13,72,067 |
| Top CALL Open Interest reduction: | |||
| Strike | OI | OI Change | Volume |
| 24,400 | 20,95,015 | -62,32,850 | 11,08,568 |
| 24,500 | 47,50,330 | -43,29,682 | 45,24,058 |
| Top CALL Volume: | |||
| Strike | OI | OI Change | Volume |
| 24,600 | 1,50,62,970 | 30,28,187 | 1,13,72,067 |
| 24,550 | 50,88,915 | 18,89,355 | 66,44,570 |
| Top PUT Open Interest: | |||
| Strike | OI | OI Change | Volume |
| 24,200 | 1,46,74,985 | 28,60,195 | 18,51,528 |
| 24,000 | 1,42,30,970 | -4,55,195 | 16,00,851 |
| Top PUT Open Interest addition: | |||
| Strike | OI | OI Change | Volume |
| 24,600 | 1,15,61,550 | 1,08,19,510 | 76,55,713 |
| 24,500 | 1,24,22,215 | 1,03,73,480 | 68,31,963 |
| Top PUT Open Interest reduction: | |||
| Strike | OI | OI Change | Volume |
| 23,650 | 14,35,655 | -39,83,135 | 5,79,416 |
| 23,200 | 29,27,275 | -32,76,065 | 3,74,210 |
| Top PUT Volume: | |||
| Strike | OI | OI Change | Volume |
| 24,600 | 1,15,61,550 | 1,08,19,510 | 76,55,713 |
| 24,550 | 82,03,715 | 78,76,765 | 72,56,693 |
NIFTY Monthly Expiry (25/08/2026)
The NIFTY index closed at 24774.3. The NIFTY monthly expiry for AUGUST 25, 2026 has revealed key trends in open interest. The current Put/Call Ratio is at 1.115 against previous 1.140. The 24000PE option holds the maximum open interest, followed by the 24000CE and 25000CE options. Market participants have shown increased interest with significant open interest additions in the 24500PE option, with open interest additions also seen in the 24600PE and 24600CE options. On the other hand, open interest reductions were prominent in the 24300CE, 23500PE, and 23400PE options. Trading volume was highest in the 25000CE option, followed by the 24000PE and 24500PE options, indicating active trading in these strikes.
| NIFTY | Monthly | Expiry: | 25-08-2026 |
| Index Spot | PCR OI | Prev PCR OI | PCR VOL |
| 24,774.30 | 1.115 | 1.140 | 1.105 |
| Total Open Interest Change in all CALLs & PUTs: | |||
| Current | Prior | Net Ch | |
| CALL: | 4,41,46,375 | 4,23,71,096 | 17,75,279 |
| PUT: | 4,92,10,915 | 4,83,19,115 | 8,91,800 |
| Top CALL Open Interest: | |||
| Strike | OI | OI Change | Volume |
| 24,000 | 59,11,945 | -1,66,627 | 16,166 |
| 25,000 | 54,00,525 | -34,125 | 1,25,637 |
| Top CALL Open Interest addition: | |||
| Strike | OI | OI Change | Volume |
| 24,600 | 15,38,160 | 5,58,057 | 60,860 |
| 25,500 | 29,89,870 | 5,29,100 | 43,322 |
| Top CALL Open Interest reduction: | |||
| Strike | OI | OI Change | Volume |
| 24,300 | 10,89,725 | -4,94,780 | 21,485 |
| 24,400 | 10,00,805 | -2,34,130 | 18,901 |
| Top CALL Volume: | |||
| Strike | OI | OI Change | Volume |
| 25,000 | 54,00,525 | -34,125 | 1,25,637 |
| 24,500 | 46,92,870 | 3,02,672 | 78,543 |
| Top PUT Open Interest: | |||
| Strike | OI | OI Change | Volume |
| 24,000 | 82,77,620 | 1,05,852 | 93,048 |
| 24,500 | 43,44,860 | 11,83,520 | 92,487 |
| Top PUT Open Interest addition: | |||
| Strike | OI | OI Change | Volume |
| 24,500 | 43,44,860 | 11,83,520 | 92,487 |
| 24,600 | 13,93,470 | 11,21,835 | 63,134 |
| Top PUT Open Interest reduction: | |||
| Strike | OI | OI Change | Volume |
| 23,500 | 27,10,500 | -4,77,880 | 47,433 |
| 23,400 | 4,30,495 | -3,24,350 | 16,908 |
| Top PUT Volume: | |||
| Strike | OI | OI Change | Volume |
| 24,000 | 82,77,620 | 1,05,852 | 93,048 |
| 24,500 | 43,44,860 | 11,83,520 | 92,487 |
BANKNIFTY Monthly Expiry (25/08/2026)
The BANKNIFTY index closed at 58247.95. The BANKNIFTY monthly expiry for AUGUST 25, 2026 has revealed key trends in open interest. The current Put/Call Ratio is at 0.887 against previous 0.857. The 58000CE option holds the maximum open interest, followed by the 58000PE and 59000CE options. Market participants have shown increased interest with significant open interest additions in the 59000CE option, with open interest additions also seen in the 58000PE and 57800CE options. On the other hand, open interest reductions were prominent in the 57300CE, 60000CE, and 57500CE options. Trading volume was highest in the 58000CE option, followed by the 59000CE and 57500CE options, indicating active trading in these strikes.
| BANKNIFTY | Monthly | Expiry: | 25-08-2026 |
| Index Spot | PCR OI | Prev PCR OI | PCR VOL |
| 58,247.95 | 0.887 | 0.857 | 0.738 |
| Total Open Interest Change in all CALLs & PUTs: | |||
| Current | Prior | Net Ch | |
| CALL: | 1,17,25,440 | 1,14,32,505 | 2,92,935 |
| PUT: | 1,04,04,360 | 97,98,495 | 6,05,865 |
| Top CALL Open Interest: | |||
| Strike | OI | OI Change | Volume |
| 58,000 | 22,18,140 | 64,680 | 1,12,935 |
| 59,000 | 13,28,700 | 3,41,490 | 92,062 |
| Top CALL Open Interest addition: | |||
| Strike | OI | OI Change | Volume |
| 59,000 | 13,28,700 | 3,41,490 | 92,062 |
| 57,800 | 2,52,270 | 1,58,160 | 62,363 |
| Top CALL Open Interest reduction: | |||
| Strike | OI | OI Change | Volume |
| 57,300 | 1,24,440 | -1,26,570 | 14,207 |
| 60,000 | 10,52,820 | -1,15,800 | 62,609 |
| Top CALL Volume: | |||
| Strike | OI | OI Change | Volume |
| 58,000 | 22,18,140 | 64,680 | 1,12,935 |
| 59,000 | 13,28,700 | 3,41,490 | 92,062 |
| Top PUT Open Interest: | |||
| Strike | OI | OI Change | Volume |
| 58,000 | 15,51,900 | 2,36,400 | 52,689 |
| 57,000 | 9,34,350 | 30,330 | 40,434 |
| Top PUT Open Interest addition: | |||
| Strike | OI | OI Change | Volume |
| 58,000 | 15,51,900 | 2,36,400 | 52,689 |
| 57,500 | 5,21,580 | 1,44,450 | 61,068 |
| Top PUT Open Interest reduction: | |||
| Strike | OI | OI Change | Volume |
| 55,000 | 4,17,750 | -66,720 | 31,262 |
| 57,300 | 99,570 | -46,410 | 13,060 |
| Top PUT Volume: | |||
| Strike | OI | OI Change | Volume |
| 57,500 | 5,21,580 | 1,44,450 | 61,068 |
| 58,000 | 15,51,900 | 2,36,400 | 52,689 |
MIDCPNIFTY Monthly Expiry (25/08/2026)
The MIDCPNIFTY index closed at 14898.15. The MIDCPNIFTY monthly expiry for AUGUST 25, 2026, 2025 has revealed key trends in open interest. The current Put/Call Ratio is at 1.090 against previous 1.056. The 15500CE option holds the maximum open interest, followed by the 13600PE and 15000CE options. Market participants have shown increased interest with significant open interest additions in the 14900CE option, with open interest additions also seen in the 14900PE and 14800PE options. On the other hand, open interest reductions were prominent in the 79300CE, 79300CE, and 79300PE options. Trading volume was highest in the 14600PE option, followed by the 15000CE and 14900CE options, indicating active trading in these strikes.
| MIDCPNIFTY | Monthly | Expiry: | 25-08-2026 |
| Index Spot | PCR OI | Prev PCR OI | PCR VOL |
| 14,898.15 | 1.090 | 1.056 | 1.150 |
| Total Open Interest Change in all CALLs & PUTs: | |||
| Current | Prior | Net Ch | |
| CALL: | 36,92,160 | 34,62,480 | 2,29,680 |
| PUT: | 40,23,480 | 36,54,840 | 3,68,640 |
| Top CALL Open Interest: | |||
| Strike | OI | OI Change | Volume |
| 15,500 | 7,75,080 | 21,360 | 6,177 |
| 15,000 | 4,12,680 | -55,680 | 13,092 |
| Top CALL Open Interest addition: | |||
| Strike | OI | OI Change | Volume |
| 14,900 | 2,48,160 | 1,72,680 | 7,968 |
| 16,000 | 3,22,080 | 39,240 | 3,519 |
| Top CALL Open Interest reduction: | |||
| Strike | OI | OI Change | Volume |
| 15,000 | 4,12,680 | -55,680 | 13,092 |
| 14,700 | 1,82,280 | -52,200 | 1,525 |
| Top CALL Volume: | |||
| Strike | OI | OI Change | Volume |
| 15,000 | 4,12,680 | -55,680 | 13,092 |
| 14,900 | 2,48,160 | 1,72,680 | 7,968 |
| Top PUT Open Interest: | |||
| Strike | OI | OI Change | Volume |
| 13,600 | 4,57,200 | -2,040 | 555 |
| 14,000 | 4,00,680 | 120 | 5,296 |
| Top PUT Open Interest addition: | |||
| Strike | OI | OI Change | Volume |
| 14,900 | 1,96,800 | 1,70,760 | 7,027 |
| 14,800 | 2,95,200 | 70,560 | 6,095 |
| Top PUT Open Interest reduction: | |||
| Strike | OI | OI Change | Volume |
| 13,500 | 3,14,880 | -34,800 | 2,297 |
| 14,100 | 60,960 | -33,240 | 1,296 |
| Top PUT Volume: | |||
| Strike | OI | OI Change | Volume |
| 14,600 | 2,85,000 | 52,560 | 13,154 |
| 14,900 | 1,96,800 | 1,70,760 | 7,027 |
Conclusion: What the NSE & BSE Indices Futures and Options Open Interest Volume Analysis Tells Us
The Final Verdict: Wrapping up today’s Open Interest Volume Analysis, the broader market sentiment remains actively constructive. The heavy short covering in both Nifty (combined OI down 4.53% with a 39% volume spike) and BankNifty (combined OI down 0.86% alongside a 61% volume surge) suggests bears were forced to aggressively unwind their positions late in the session. Meanwhile, Midcap Nifty and Sensex futures are seeing confident fresh long build-ups.
Actionable Feedback & Key Levels: A “buy on dips” playbook remains optimal for the week. For Nifty traders, 24600 is acting as immediate resistance based on the highest call additions, but the 24200 Put base offers rock-solid support with Max Pain anchored at 24550. For BankNifty, keep a tight watch on the 58000 straddle zone—it’s acting as a heavy magnet for both Call and Put writers; any sustained breakout above the 58200 mark could trigger a massive gamma blast toward the 59000 level.
Trading the “New Normal”: Going forward, do not blindly carry unhedged overnight positions just because a future looks “cheap” at a discount. The new 3:15 PM to 3:40 PM CAS adjustment window is going to continuously skew spot-future spreads. Trust the OI shifts, respect your max pain levels, and size your positions conservatively while the market fully digests this structural shift!
Check Previous Day’s NSE & BSE Indices F&O Analysis
FII / FPI trading activity in Capital Market Segment
NSE Derivatives Raw Data
BSE Derivatives Raw Data
Disclaimer
fnodata.com is a financial blog providing research-based data and analysis. The content creator of the fnodata.com is not a SEBI registered Investment Advisor. The content on this blog is for informational purposes only and should not be considered as investment advice. You are responsible for your own investment decisions. You should consult with a financial advisor or conduct your own research before making any investment decisions.