Turning Complex Derivative Data into Clear Market Insights

NSE & BSE Indices Futures and Options Open Interest Volume Analysis for 15/09/2026

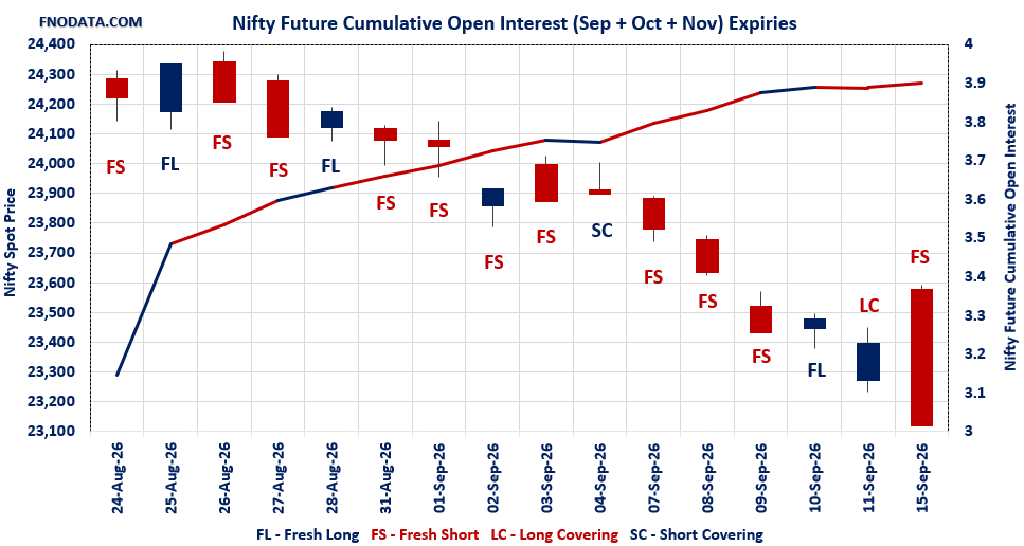
Table of Contents
Running our daily Open Interest Volume Analysis, the standout structural development is not just the steady bleed in headline indices, but the outright institutional short blitzkrieg unleashed on midcaps.
Decoupling the tenors shows that this is far from tactical hedging: MIDCPNIFTY saw combined futures Open Interest explode by an incredible +39.50% on a 132% volume surge, with front-month contracts collapsing into a sharp discount as aggressive Fresh Shorts (+40.76% OI) completely overwhelmed the tape.
Meanwhile, NIFTY and BANKNIFTY steadily built structural Fresh Shorts into the October series, driving weekly and monthly Put-Call Ratios well below parity and pulling the market deeper into a negative gamma regime. Let’s break down the strike-level inventory, basis shifts, and exact inflection nodes to prepare your desk for the sessions ahead!
NSE & BSE F&O Market Signals
NIFTY Future analysis
NIFTY Spot closed at: 23118.6 (-1.195%)
Combined = September + October + November
Combined Fut Open Interest Change: 1.28%
Combined Fut Volume Change: 13.66%
Combined Fut Open Interest Analysis: Fresh Short
Rollover: 19% Previous 18%
NIFTY SEPTEMBER Future closed at: 23223.9 (-1.113%)
Sep Fut Premium105.3 (Increased by 18.2 points)
Sep Fut Open Int erest Change: 0.59%
Sep Fut Volume Change: 15.41%
Sep Fut Open Interest Analysis: Fresh Short
NIFTY OCTOBER Future closed at: 23332 (-1.079%)
Oct Fut Premium 213.4 (Increased by 24.9 points)
Oct Fut Open Interest Change: 3.92%
Oct Fut Volume Change: 1.92%
Oct Fut Open Interest Analysis: Fresh Short
NIFTY Weekly Expiry (22/09/2026) Option Analysis
Put-Call Ratio (Open Interest): 0.657 (Decreased from 0.797)
Put-Call Ratio (Volume): 0.641
Max Pain Level: 23350
Maximum CALL Open Interest: 25000
Maximum PUT Open Interest: 21700
Highest CALL Addition: 23400
Highest PUT Addition: 23200
NIFTY Monthly Expiry (29/09/2026) Option Analysis
Put-Call Ratio (Open Interest): 0.968 (Decreased from 1.002)
Put-Call Ratio (Volume): 0.803
Max Pain Level: 24000
Maximum CALL Open Interest: 24000
Maximum PUT Open Interest: 23000
Highest CALL Addition: 23500
Highest PUT Addition: 23200
BANKNIFTY Future Analysis
BANKNIFTY Spot closed at: 55794.75 (-1.434%)
Combined = September + October + November
Combined Fut Open Interest Change: 2.22%
Combined Fut Volume Change: 6.43%
Combined Fut Open Interest Analysis: Fresh Short
Rollover: 13% Previous 13%
BANKNIFTY SEPTEMBER Future closed at: 56079.4 (-1.389%)
Sep Fut Premium 284.65 (Increased by 22 points)
Sep Fut Open Interest Change: 1.6%
Sep Fut Volume Change: 7.4%
Sep Fut Open Interest Analysis: Fresh Short
BANKNIFTY OCTOBER Future closed at: 56380.6 (-1.350%)
Oct Fut Premium 585.85 (Increased by 40.4 points)
Oct Fut Open Interest Change: 5.97%
Oct Fut Volume Change: 2.11%
Oct Fut Open Interest Analysis: Fresh Short
BANKNIFTY Monthly Expiry (29/09/2026) Option Analysis
Put-Call Ratio (Open Interest): 0.785 (Decreased from 0.914)
Put-Call Ratio (Volume): 0.899
Max Pain Level: 57100
Maximum CALL Open Interest: 57500
Maximum PUT Open Interest: 57500
Highest CALL Addition: 57000
Highest PUT Addition: 53500
MIDCPNIFTY Future Analysis
MIDCPNIFTY Spot closed at: 14266.35 (-2.183%)
Combined = September + October + November
Combined Fut Open Interest Change: 39.50%
Combined Fut Volume Change: 132.72%
Combined Fut Open Interest Analysis: Fresh Short
Rollover: 4% Previous 5%
MIDCPNIFTY SEPTEMBER Future closed at: 14247.8 (-2.688%)
Sep Fut Discount -18.55 (Decreased by -75.15 points)
Sep Fut Open Interest Change: 40.76%
Sep Fut Volume Change: 145.65%
Sep Fut Open Interest Analysis: Fresh Short
MIDCPNIFTY OCTOBER Future closed at: 14288.8 (-2.671%)
Oct Fut Premium 22.45 (Decreased by -73.85 points)
Oct Fut Open Interest Change: 16.03%
Oct Fut Volume Change: 26.97%
Oct Fut Open Interest Analysis: Fresh Short
MIDCPNIFTY Monthly Expiry (29/09/2026) Option Analysis
Put-Call Ratio (Open Interest): 0.818 (Decreased from 1.003)
Put-Call Ratio (Volume): 1.082
Max Pain Level: 14600
Maximum CALL Open Interest: 15000
Maximum PUT Open Interest: 14000
Highest CALL Addition: 15000
Highest PUT Addition: 13500
SENSEX Monthly Expiry (24/09/2026) Future
SENSEX Spot closed at: 74,003.82 (-1.040%)
SENSEX Monthly Future closed at: 74,279.05 (-1.090%)
Premium: 275.23 (Decreased by -40.71 points)
Open Interest Change: -0.09%
Volume Change: 5.87%
Open Interest Analysis: Long Covering
SENSEX Weekly Expiry (10/09/2026) Option Analysis
Put-Call Ratio (OI): 0.698 (Decreased from 1.197)
Put-Call Ratio (Volume): 1.100
Max Pain Level: 74500
Maximum CALL OI: 77000
Maximum PUT OI: 71000
Highest CALL Addition: 77000
Highest PUT Addition: 71000
FII & DII Cash Market Activity
FIIs Net SELL: ₹ 2,977.86 Cr.
DIIs Net BUY: ₹ 2,686.05 Cr.
FII Derivatives Activity
| FII Trading Stats | 15.09.26 | 11.09.26 | 10.09.26 |
| FII Cash (Provisional Data) | -2,977.86 | -930.9 | -438.24 |
| Index Future Open Interest Long Ratio | 12.06% | 11.23% | 10.99% |
| Index Future Volume Long Ratio | 44.28% | 45.50% | 37.00% |
| Call Option Open Interest Long Ratio | 38.57% | 41.24% | 39.89% |
| Call Option Volume Long Ratio | 49.36% | 50.16% | 50.30% |
| Put Option Open Interest Long Ratio | 73.59% | 66.80% | 70.89% |
| Put Option Volume Long Ratio | 50.22% | 50.04% | 50.03% |
| Stock Future Open Interest Long Ratio | 53.93% | 54.07% | 54.25% |
| Stock Future Volume Long Ratio | 48.48% | 47.67% | 46.68% |
| Index Futures | Fresh Short | Fresh Short | Fresh Short |
| Index Options | Long Covering | Fresh Long | Fresh Long |
| Nifty Futures | Fresh Short | Fresh Short | Fresh Short |
| Nifty Options | Long Covering | Fresh Long | Fresh Long |
| BankNifty Futures | Long Covering | Fresh Long | Fresh Long |
| BankNifty Options | Fresh Short | Fresh Long | Fresh Long |
| FinNifty Futures | Fresh Short | Short Covering | Fresh Short |
| FinNifty Options | Long Covering | Fresh Long | Fresh Short |
| MidcpNifty Futures | Fresh Long | Fresh Short | Short Covering |
| MidcpNifty Options | Fresh Short | Fresh Long | Fresh Long |
| NiftyNxt50 Futures | Short Covering | Short Covering | Fresh Short |
| NiftyNxt50 Options | Long Covering | Fresh Short | Fresh Short |
| Stock Futures | Long Covering | Fresh Short | Fresh Short |
| Stock Options | Fresh Short | Fresh Long | Fresh Long |
NSE & BSE Option market Trends : Options Insights
SENSEX weekly Expiry (17/09/2026)
The SENSEX index closed at 74003.82. The SENSEX weekly expiry for SEPTEMBER 17, 2026 has revealed key trends in open interest. The current Put/Call Ratio is at 0.698 against previous 1.197. The 77000CE option holds the maximum open interest, followed by the 75000CE and 71000PE options. Market participants have shown increased interest with significant open interest additions in the 71000PE option, with open interest additions also seen in the 77000CE and 76000CE options. On the other hand, open interest reductions were prominent in the 74800PE, 74500PE
| SENSEX | Weekly | Expiry: | 17-09-2026 |
| Index Spot | PCR OI | Prev PCR OI | PCR VOL |
| 74003.82 | 0.698 | 1.197 | 1.100 |
| Total Open Interest Change in all CALLs & PUTs: | |||
| Current | Prior | Net Ch | |
| CALL: | 2,73,96,940 | 1,07,11,720 | 1,66,85,220 |
| PUT: | 1,91,36,220 | 1,28,20,280 | 63,15,940 |
| Top CALL Open Interest: | |||
| Strike | OI | OI Change | Volume |
| 77000 | 20,54,800 | 14,57,580 | 1,03,42,940 |
| 75000 | 19,47,880 | 11,69,680 | 2,42,79,960 |
| Top CALL Open Interest addition: | |||
| Strike | OI | OI Change | Volume |
| 77000 | 20,54,800 | 14,57,580 | 1,03,42,940 |
| 76000 | 17,81,680 | 11,84,220 | 1,24,83,660 |
| Top CALL Open Interest reduction: | |||
| Strike | OI | OI Change | Volume |
| 78200 | 1,02,780 | -84,980 | 9,49,900 |
| 77600 | 66,200 | -62,540 | 8,39,940 |
| Top CALL Volume: | |||
| Strike | OI | OI Change | Volume |
| 75000 | 19,47,880 | 11,69,680 | 2,42,79,960 |
| 75500 | 12,97,700 | 7,76,680 | 1,38,12,500 |
| Top PUT Open Interest: | |||
| Strike | OI | OI Change | Volume |
| 71000 | 18,93,980 | 14,73,600 | 72,04,520 |
| 70000 | 14,08,320 | 5,51,200 | 62,33,720 |
| Top PUT Open Interest addition: | |||
| Strike | OI | OI Change | Volume |
| 71000 | 18,93,980 | 14,73,600 | 72,04,520 |
| 70000 | 14,08,320 | 5,51,200 | 62,33,720 |
| Top PUT Open Interest reduction: | |||
| Strike | OI | OI Change | Volume |
| 74800 | 1,96,340 | -1,43,900 | 1,01,33,640 |
| 74500 | 4,49,040 | -1,39,760 | 1,88,43,460 |
| Top PUT Volume: | |||
| Strike | OI | OI Change | Volume |
| 74000 | 9,27,440 | 2,02,240 | 1,97,83,580 |
| 74500 | 4,49,040 | -1,39,760 | 1,88,43,460 |
NIFTY Weekly Expiry (15/09/2026)
The NIFTY index closed at 23118.6. The NIFTY weekly expiry for SEPTEMBER 22, 2026 has revealed key trends in open interest. The current Put/Call Ratio is at 0.657 against previous 0.797. The 25000CE option holds the maximum open interest, followed by the 24000CE and 23400CE options. Market participants have shown increased interest with significant open interest additions in the 23400CE option, with open interest additions also seen in the 25000CE and 24000CE options. On the other hand, open interest reductions were prominent in the 23550PE, 25650CE
| NIFTY | Weekly | Expiry: | 22-09-2026 |
| Index Spot | PCR OI | Prev PCR OI | PCR VOL |
| 23,118.60 | 0.657 | 0.797 | 0.641 |
| Total Open Interest Change in all CALLs & PUTs: | |||
| Current | Prior | Net Ch | |
| CALL: | 10,30,49,375 | 4,57,35,950 | 5,73,13,425 |
| PUT: | 6,76,60,580 | 3,64,66,170 | 3,11,94,410 |
| Top CALL Open Interest: | |||
| Strike | OI | OI Change | Volume |
| 25,000 | 78,03,120 | 37,00,190 | 4,67,906 |
| 24,000 | 68,69,850 | 36,12,115 | 3,85,183 |
| Top CALL Open Interest addition: | |||
| Strike | OI | OI Change | Volume |
| 23,400 | 62,71,525 | 42,02,900 | 4,64,225 |
| 25,000 | 78,03,120 | 37,00,190 | 4,67,906 |
| Top CALL Open Interest reduction: | |||
| Strike | OI | OI Change | Volume |
| 25,650 | 13,975 | -10,335 | 1,126 |
| 25,350 | 12,480 | -7,670 | 857 |
| Top CALL Volume: | |||
| Strike | OI | OI Change | Volume |
| 23,500 | 58,47,075 | 30,70,730 | 5,80,037 |
| 25,000 | 78,03,120 | 37,00,190 | 4,67,906 |
| Top PUT Open Interest: | |||
| Strike | OI | OI Change | Volume |
| 21,700 | 52,25,805 | 21,61,770 | 1,80,937 |
| 23,000 | 47,47,600 | 19,15,550 | 3,73,233 |
| Top PUT Open Interest addition: | |||
| Strike | OI | OI Change | Volume |
| 23,200 | 45,52,925 | 28,72,025 | 3,94,864 |
| 22,000 | 46,24,815 | 26,51,350 | 1,98,565 |
| Top PUT Open Interest reduction: | |||
| Strike | OI | OI Change | Volume |
| 23,550 | 1,54,895 | -32,695 | 26,672 |
| – | – | – | – |
| Top PUT Volume: | |||
| Strike | OI | OI Change | Volume |
| 23,200 | 45,52,925 | 28,72,025 | 3,94,864 |
| 23,000 | 47,47,600 | 19,15,550 | 3,73,233 |
NIFTY Monthly Expiry (29/09/2026)
The NIFTY index closed at 23118.6. The NIFTY monthly expiry for SEPTEMBER 29, 2026 has revealed key trends in open interest. The current Put/Call Ratio is at 0.968 against previous 1.002. The 24000CE option holds the maximum open interest, followed by the 23000PE and 24000PE options. Market participants have shown increased interest with significant open interest additions in the 23500CE option, with open interest additions also seen in the 23200PE and 23300CE options. On the other hand, open interest reductions were prominent in the 25000CE, 24500CE
| NIFTY | Monthly | Expiry: | 29-09-2026 |
| Index Spot | PCR OI | Prev PCR OI | PCR VOL |
| 23,118.60 | 0.968 | 1.002 | 0.803 |
| Total Open Interest Change in all CALLs & PUTs: | |||
| Current | Prior | Net Ch | |
| CALL: | 7,94,31,250 | 7,33,41,920 | 60,89,330 |
| PUT: | 7,68,59,750 | 7,34,99,020 | 33,60,730 |
| Top CALL Open Interest: | |||
| Strike | OI | OI Change | Volume |
| 24,000 | 91,99,710 | 6,91,795 | 1,74,130 |
| 24,500 | 54,96,335 | -4,06,705 | 81,622 |
| Top CALL Open Interest addition: | |||
| Strike | OI | OI Change | Volume |
| 23,500 | 44,46,195 | 12,49,560 | 1,79,177 |
| 23,300 | 19,43,370 | 10,60,085 | 94,662 |
| Top CALL Open Interest reduction: | |||
| Strike | OI | OI Change | Volume |
| 25,000 | 51,35,000 | -5,21,560 | 56,078 |
| 24,500 | 54,96,335 | -4,06,705 | 81,622 |
| Top CALL Volume: | |||
| Strike | OI | OI Change | Volume |
| 23,500 | 44,46,195 | 12,49,560 | 1,79,177 |
| 24,000 | 91,99,710 | 6,91,795 | 1,74,130 |
| Top PUT Open Interest: | |||
| Strike | OI | OI Change | Volume |
| 23,000 | 65,43,460 | 2,15,825 | 1,27,006 |
| 24,000 | 59,56,090 | -98,700 | 29,440 |
| Top PUT Open Interest addition: | |||
| Strike | OI | OI Change | Volume |
| 23,200 | 25,20,895 | 10,73,540 | 86,290 |
| 23,300 | 30,52,140 | 5,74,925 | 1,23,136 |
| Top PUT Open Interest reduction: | |||
| Strike | OI | OI Change | Volume |
| 23,800 | 17,57,340 | -2,06,830 | 16,446 |
| 22,800 | 12,63,925 | -1,45,925 | 56,821 |
| Top PUT Volume: | |||
| Strike | OI | OI Change | Volume |
| 23,500 | 45,95,890 | -28,665 | 1,36,541 |
| 23,000 | 65,43,460 | 2,15,825 | 1,27,006 |
BANKNIFTY Monthly Expiry (29/09/2026)
The BANKNIFTY index closed at 55794.75. The BANKNIFTY monthly expiry for SEPTEMBER 29, 2026 has revealed key trends in open interest. The current Put/Call Ratio is at 0.785 against previous 0.914. The 57500CE option holds the maximum open interest, followed by the 58000CE and 57500PE options. Market participants have shown increased interest with significant open interest additions in the 57000CE option, with open interest additions also seen in the 56000CE and 56500CE options. On the other hand, open interest reductions were prominent in the 57500PE, 56000PE
| BANKNIFTY | Monthly | Expiry: | 29-09-2026 |
| Index Spot | PCR OI | Prev PCR OI | PCR VOL |
| 55,794.75 | 0.785 | 0.914 | 0.899 |
| Total Open Interest Change in all CALLs & PUTs: | |||
| Current | Prior | Net Ch | |
| CALL: | 1,80,45,540 | 1,60,84,050 | 19,61,490 |
| PUT: | 1,41,69,450 | 1,46,97,000 | -5,27,550 |
| Top CALL Open Interest: | |||
| Strike | OI | OI Change | Volume |
| 57,500 | 21,93,720 | 57,510 | 64,052 |
| 58,000 | 16,59,510 | 1,28,250 | 76,815 |
| Top CALL Open Interest addition: | |||
| Strike | OI | OI Change | Volume |
| 57,000 | 11,42,460 | 3,02,820 | 1,00,101 |
| 56,000 | 5,37,090 | 2,74,830 | 65,295 |
| Top CALL Open Interest reduction: | |||
| Strike | OI | OI Change | Volume |
| 59,400 | 81,000 | -32,070 | 4,062 |
| 61,500 | 3,31,140 | -18,420 | 5,944 |
| Top CALL Volume: | |||
| Strike | OI | OI Change | Volume |
| 57,000 | 11,42,460 | 3,02,820 | 1,00,101 |
| 56,500 | 6,67,230 | 2,68,080 | 97,550 |
| Top PUT Open Interest: | |||
| Strike | OI | OI Change | Volume |
| 57,500 | 15,93,960 | -77,790 | 10,029 |
| 56,000 | 8,04,300 | -63,960 | 1,19,847 |
| Top PUT Open Interest addition: | |||
| Strike | OI | OI Change | Volume |
| 53,500 | 4,13,040 | 1,26,060 | 22,248 |
| 53,700 | 23,250 | 23,250 | 2,210 |
| Top PUT Open Interest reduction: | |||
| Strike | OI | OI Change | Volume |
| 57,500 | 15,93,960 | -77,790 | 10,029 |
| 56,000 | 8,04,300 | -63,960 | 1,19,847 |
| Top PUT Volume: | |||
| Strike | OI | OI Change | Volume |
| 56,000 | 8,04,300 | -63,960 | 1,19,847 |
| 56,500 | 5,91,120 | -40,080 | 79,423 |
MIDCPNIFTY Monthly Expiry (29/09/2026)
The MIDCPNIFTY index closed at 14266.35. The MIDCPNIFTY monthly expiry for SEPTEMBER 29, 2026, 2025 has revealed key trends in open interest. The current Put/Call Ratio is at 0.818 against previous 1.003. The 14000PE option holds the maximum open interest, followed by the 15000CE and 13500PE options. Market participants have shown increased interest with significant open interest additions in the 15000CE option, with open interest additions also seen in the 14500CE and 13500PE options. On the other hand, open interest reductions were prominent in the 74000CE, 74500CE
| MIDCPNIFTY | Monthly | Expiry: | 29-09-2026 |
| Index Spot | PCR OI | Prev PCR OI | PCR VOL |
| 14,266.35 | 0.818 | 1.003 | 1.082 |
| Total Open Interest Change in all CALLs & PUTs: | |||
| Current | Prior | Net Ch | |
| CALL: | 80,46,840 | 61,40,040 | 19,06,800 |
| PUT: | 65,82,480 | 61,57,200 | 4,25,280 |
| Top CALL Open Interest: | |||
| Strike | OI | OI Change | Volume |
| 15,000 | 10,35,120 | 3,08,880 | 12,831 |
| 14,500 | 6,24,600 | 2,21,280 | 13,717 |
| Top CALL Open Interest addition: | |||
| Strike | OI | OI Change | Volume |
| 15,000 | 10,35,120 | 3,08,880 | 12,831 |
| 14,500 | 6,24,600 | 2,21,280 | 13,717 |
| Top CALL Open Interest reduction: | |||
| Strike | OI | OI Change | Volume |
| 16,000 | 3,78,960 | -50,520 | 2,273 |
| 15,900 | 1,39,200 | -25,320 | 692 |
| Top CALL Volume: | |||
| Strike | OI | OI Change | Volume |
| 14,500 | 6,24,600 | 2,21,280 | 13,717 |
| 15,000 | 10,35,120 | 3,08,880 | 12,831 |
| Top PUT Open Interest: | |||
| Strike | OI | OI Change | Volume |
| 14,000 | 12,01,200 | -39,480 | 19,365 |
| 13,500 | 6,99,960 | 1,97,280 | 8,582 |
| Top PUT Open Interest addition: | |||
| Strike | OI | OI Change | Volume |
| 13,500 | 6,99,960 | 1,97,280 | 8,582 |
| 13,800 | 3,07,800 | 1,37,880 | 9,581 |
| Top PUT Open Interest reduction: | |||
| Strike | OI | OI Change | Volume |
| 14,500 | 6,10,080 | -69,480 | 18,483 |
| 14,000 | 12,01,200 | -39,480 | 19,365 |
| Top PUT Volume: | |||
| Strike | OI | OI Change | Volume |
| 14,000 | 12,01,200 | -39,480 | 19,365 |
| 14,500 | 6,10,080 | -69,480 | 18,483 |
Conclusion: What the NSE & BSE Indices Futures and Options Open Interest Volume Analysis Tells Us
To synthesize today’s Open Interest Volume Analysis, the derivatives tape confirms an aggressive supply overhang across all tenors; however, with short-term sentiment indicators stretched, execution demands selling failed tests at overhead supply zones rather than chasing deep intraday cuts:
NIFTY (Call Writers Lowering the Ceiling): While front-month September added mild Fresh Shorts (+0.59% OI), October absorbed structural short additions (+3.92% OI), keeping institutional pressure tilted downward. In the weekly series (22/09 expiry), the PCR slid from 0.797 to 0.657, with quantitative call writers anchoring their heaviest additions down at 23,400, while put additions remain scattered at 23,200 and 21,700. Actionable Feedback: The 23,350–23,400 zone (confluence of weekly Max Pain and Highest Call Addition) acts as the primary institutional ceiling. Long setups are invalidated below 23,400. Initiate tactical shorts on low-volume rejections near 23,250–23,300 with a stop-loss above 23,380, targeting 23,050 and the structural 23,000 monthly put node.
BANKNIFTY (Synchronized Short Build-Up): The banking index saw consistent short creation across the curve (+1.6% in Sep, +5.97% in Oct). Monthly PCR collapsed from 0.914 to 0.785, signaling complete put-side capitulation. Call writers reinforced 57,000 as the ultimate overhead barrier, while put writers pushed support expectations all the way down to 53,500. Actionable Feedback: Maintain a disciplined “Sell on Rise” stance. Fade intraday pullbacks into the 56,100–56,250 supply cluster, keeping risk defined with a strict stop-loss above 56,450, looking for targets at 55,500 and 55,000.
MIDCPNIFTY (Structural Breakdown & Panic Shorting): The broader market decoupling narrative is completely dead. Front-month September futures flipped into a -18.55 point discount (cratering by 75 points) on an extraordinary +40.76% OI surge, while October absorbed +16.03% in Fresh Shorts. Monthly PCR tumbled to 0.818, with the highest call concentration sitting heavily at 15,000 and put support retreating to 13,500. Actionable Feedback: Do not attempt to catch this falling knife. The aggressive negative basis confirms high-conviction institutional shorting. Look to sell corrective bounces into the 14,350–14,400 zone, using a stop-loss at 14,480, targeting 14,100 and the 14,000 psychological handle.
SENSEX (Bulls Capitulate / Long Liquidation): Unlike the aggressive short build in other indices, SENSEX futures registered tactical Long Covering (-0.09% OI with a 40-point premium drop), reflecting outright bull exhaustion. The weekly PCR plummeted from 1.197 to 0.698, with call writers asserting dominance at the 75,000 strike (Max Pain at 74,500). Actionable Feedback: Upside remains firmly capped. Sell into any pre-settlement short-covering pullbacks toward 74,300–74,500 with a firm stop-loss placed above 74,650, targeting downside momentum toward 73,800 and 73,400.
Check Previous Day’s NSE & BSE Indices F&O Analysis
FII / FPI trading activity in Capital Market Segment
NSE Derivatives Raw Data
BSE Derivatives Raw Data
Disclaimer
fnodata.com is a financial blog providing research-based data and analysis. The content creator of the fnodata.com is not a SEBI registered Investment Advisor. The content on this blog is for informational purposes only and should not be considered as investment advice. You are responsible for your own investment decisions. You should consult with a financial advisor or conduct your own research before making any investment decisions.